Matplotlib.pyplot.rc() in Python
Last Updated :
19 Apr, 2020
Matplotlib is an amazing visualization library in Python for 2D plots of arrays. Matplotlib is a multi-platform data visualization library built on NumPy arrays and designed to work with the broader SciPy stack.
matplotlib.pyplot.rc()
matplotlib.pyplot.rc() function is used to the rc params. Grouping in rc is done through the ‘group'(eg, for lines). For lines in axes the group is linewidth. The group for axes is facecolor and so on. A list or tuple can also act as a group name(eg, xtick, ytick). Kwargs act as a name value pair which broadly is a dictionary, eg:
Syntax:
rc(‘lines’, linewidth=3, color=’g’)
It sets the current rc params and is same as
rcParams[‘lines.linewidth’] = 3
rcParams[‘lines.color’] = ‘g’
To save typing for interactive users the following aliases are available:
| Alias |
Property |
| ‘lw’ |
‘linewidth’ |
| ‘ls’ |
‘linestyle’ |
| ‘c’ |
‘color’ |
| ‘fc’ |
‘facecolor’ |
| ‘ec’ |
‘edgecolor’ |
| ‘mew’ |
‘markeredgewidth’ |
| ‘aa’ |
‘antialiased’ |
Therefore once could abbreviate the above rc commands as follows
rc(‘lines’, lw=3, c=’g’)
Note: One can use the pythons kwargs dictionary to store dictionaries of its default parameters. For example,
font = {‘family’ : ‘monospace’,
‘weight’ : ‘italic’,
‘size’ : ‘medium’}
# pass in the font dict as kwargs
rc(‘font’, **font)
This helps in easily switching among different configurations. you can also use matplotlib.style.use(‘default’) or rcdefaults() to restore back the rc params after change.
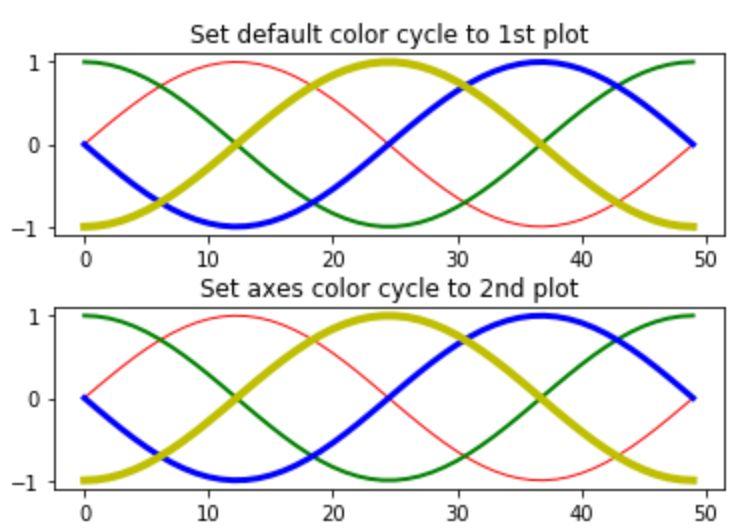
Example 1:
from cycler import cycler
import numpy as np
import matplotlib.pyplot as plt
sample_cycler = (cycler(color =['r', 'g',
'b', 'y']) +
cycler(lw =[1, 2, 3, 4]))
plt.rc('lines', linewidth = 4)
plt.rc('axes', prop_cycle = sample_cycler)
A = np.linspace(0, 2 * np.pi, 50)
line_offsets = np.linspace(0, 2 * np.pi, 4,
endpoint = False)
B = np.transpose([np.sin(A + phi) for phi in line_offsets])
figure, (axes0, axes1) = plt.subplots(nrows = 2)
axes0.plot(B)
axes0.set_title('Set default color cycle to 1st plot')
axes1.set_prop_cycle(sample_cycler)
axes1.plot(B)
axes1.set_title('Set axes color cycle to 2nd plot')
figure.subplots_adjust(hspace = 0.4)
plt.show()
|
Output:
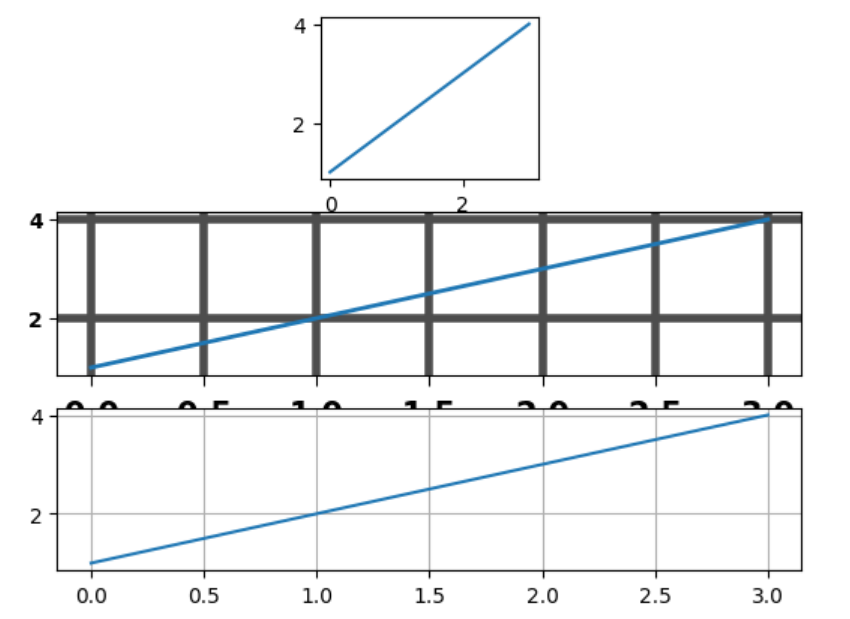
Example 2:
import matplotlib.pyplot as plt
plt.subplot(332)
plt.plot([1, 2, 3, 4])
plt.rc('font', weight ='bold')
plt.rc('xtick.major', size = 5, pad = 7)
plt.rc('xtick', labelsize = 15)
plt.rc('grid', c ='0.3', ls ='-', lw = 4)
plt.rc('lines', lw = 2, color ='g')
plt.subplot(312)
plt.plot([1, 2, 3, 4])
plt.grid(True)
plt.rcdefaults()
plt.subplot(313)
plt.plot([1, 2, 3, 4])
plt.grid(True)
plt.show()
|
Output:
Like Article
Suggest improvement
Share your thoughts in the comments
Please Login to comment...