Matplotlib.pyplot.quiver() in Python
Last Updated :
10 Apr, 2024
Matplotlib
is a library of Python bindings which provides the user with a MATLAB-like plotting framework. Matplotlib can be used in Python scripts, the Python and IPython shell, web application servers, and various graphical user interface toolkits like Tkinter, awxPython, etc.
Matplotlib.pyplot.quiver()
matplotlib.pyplot.quiver
method is used to plot a 2D field of arrows.
Syntax: matplotlib.pyplot.quiver(x_coordinate, y_coordinate, x_direction, y_direction) Parameters:x_coordinate : x-coordinate of the arrow location y_coordinate : y-coordinate of the arrow location x_direction : x-component of the direction of the arrow y_direction : y-component of the direction of the arrow Optional Parameters:scale: used to set the scale of the graph scale_units: used to set the units of the plane with respect to x and y angle: used to determine the angle of the arrow vectors plotted Return Value : Returns a 2D graph with arrows plotted
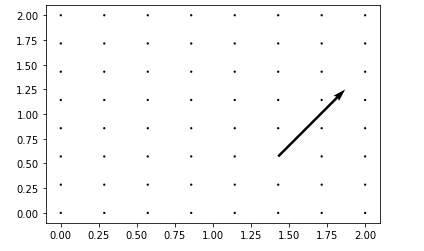
Example #1
Python 1==
#Python program to explain
# matplotlib.pyplot.quiver method


import matplotlib.pyplot as plt
import numpy as np

#defining necessary arrays
x = np.linspace(0,2,8)
y = np.linspace(2,0,8)
x_dir = y_dir = np.zeros((8,8))
y_dir[5,5] = 0.2

#plotting the 2D graph
plt.quiver(x, y, x_dir, y_dir, scale=1)
Output:
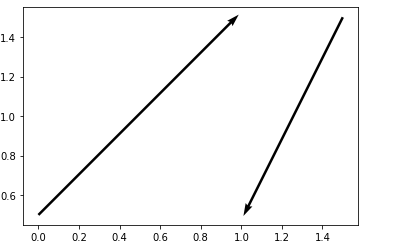
Example #2
Plotting multiple arrows on a graph using
quiver
method
Python3 1==
# Python program to explain
# matplotlib.pyplot.quiver method

# importing necessary libraries
import matplotlib.pyplot as plt

# defining necessary arrays
x_coordinate = [0, 1.5]
y_coordinate = [0.5, 1.5]
x_direction = [1, -0.5]
y_direction = [1, -1]

# plotting the graph
plt.quiver(x_coordinate, y_coordinate,
           x_direction, y_direction,
           scale_units ='xy', scale = 1.)
Output:
Share your thoughts in the comments
Please Login to comment...