Matplotlib.pyplot.matshow() in Python
Last Updated :
03 Sep, 2021
Matplotlib is an amazing visualization library in Python for 2D plots of arrays. Matplotlib is a multi-platform data visualization library built on NumPy arrays and designed to work with the broader SciPy stack. It was introduced by John Hunter in the year 2002.
matplotlib.pyplot.matshow()
matplotlib.pyplot.matshow() function is used to represent an array as a matrix in a new figure window. the upper left-hand corner is set as the origin and the rows (first dimension of the array) are displayed in a horizontal form. The aspect ratio of the figure window is set according to the array to avoid short and narrow figures. The x-axis Tick labels are placed at the top.
Syntax: matplotlib.pyplot.matshow(A, fignum=None, **kwargs)
Parameters:
- A:: It is an array like object that represents the matrix. It is a required parameter.
- fignum: It accepts three values namely ‘None’, ‘False’ or an integer value. If the value is set to None it would create a new window of the figure with automated numbering. If the value is a non-zero integer then it is drawn into the figure respective to the given number or it creates it if it doesn’t exist. If the ‘0’ is set as the value of this parameter then it uses the current axes or it creates one if it doesn’t exist.
Returns: It returns an image of Axesimage class.
Other parameters: It also accepts the imshow argument for showing image.
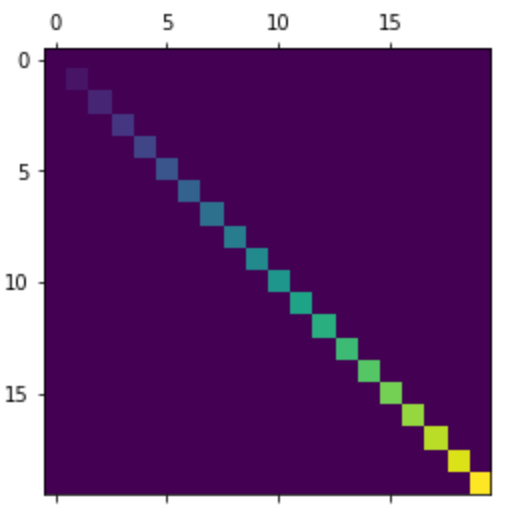
Example 1:
Python3
import matplotlib.pyplot as plot
import numpy as np
array = np.diag(range(20))
plot.matshow(array)
plot.show()
|
Output:
Example 2:
Python3
import numpy as np
import matplotlib.pyplot as plt
alphabets = ['A', 'B', 'C', 'D', 'E']
random_array = np.random.random((5, 5))
figure = plt.figure()
axes = figure.add_subplot(111)
caxes = axes.matshow(random_array, interpolation ='nearest')
figure.colorbar(caxes)
axes.set_xticklabels(['']+alphabets)
axes.set_yticklabels(['']+alphabets)
plt.show()
|
Output:

Like Article
Suggest improvement
Share your thoughts in the comments
Please Login to comment...