Matplotlib.pyplot.margins() function in Python
Last Updated :
03 Jan, 2021
Prerequisites: Matplotlib
Matplotlib.pyplot.margins() is a function used to set the margins of the x and y axes. All input parameters must be a float that too within the range [0, 1]. We cannot pass both positional and keyword arguments at once as that will raise a TypeError. The padding added to each limit of the axes is the margin times the data interval for that axis. If no arguments are provided, the existing margins remain in place. Specifying margins changes auto-scaling.
- If only one float value if provided, that is taken as margins for both x and y axes.
- If two float values are provided, they will be taken to specify x-margin and y-margin axes respectively.
Syntax:
margins(x, y, tight)
Parameters
– x, y : Used to specify margin values for x and y axes. These can only be used individually.
– tight : Boolean
- If this parameter is specified as True, then it is considered the specified margins require no additional padding to match tick marks.
- If this parameter is set to None, it will preserve original setting.
Various implementation for using this function is given below:
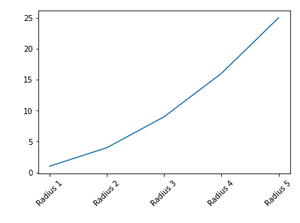
Example: General application
Python3
import matplotlib.pyplot as plt
x = [1, 2, 3, 4, 5]
labels = ['Radius 1', 'Radius 2', 'Radius 3', 'Radius 4', 'Radius 5']
y = [i**2 for i in x]
plt.plot(x, y)
plt.xticks(x, labels, rotation=45)
plt.margins()
plt.show()
|
Output:
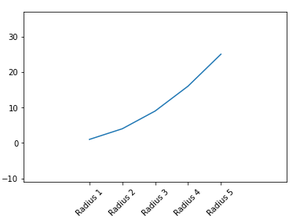
Example : Passing arguments to the margins() function
Python3
import matplotlib.pyplot as plt
x = [1, 2, 3, 4, 5]
labels = ['Radius 1', 'Radius 2', 'Radius 3', 'Radius 4', 'Radius 5']
y = [i**2 for i in x]
plt.plot(x, y)
plt.xticks(x, labels, rotation=45)
plt.margins(0.5)
plt.show()
|
Output:
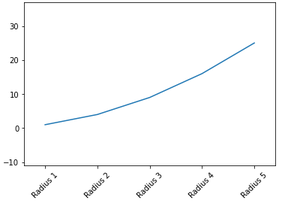
Example: Passing different values for x and y that are less than 1, the graph produced will be zoomed in
Python3
import matplotlib.pyplot as plt
x = [1, 2, 3, 4, 5]
labels = ['Radius 1', 'Radius 2', 'Radius 3', 'Radius 4', 'Radius 5']
y = [i**2 for i in x]
plt.plot(x, y)
plt.xticks(x, labels, rotation=45)
plt.margins(x=0.1, y=0.5)
plt.show()
|
Output:
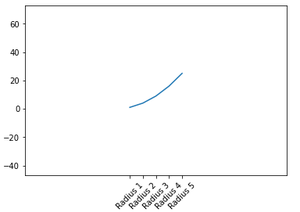
Example: Passing different values for x and y that are greater than , the graph produced will be zoomed out
Python3
import matplotlib.pyplot as plt
x = [1, 2, 3, 4, 5]
labels = ['Radius 1', 'Radius 2', 'Radius 3', 'Radius 4', 'Radius 5']
y = [i**2 for i in x]
plt.plot(x, y)
plt.xticks(x, labels, rotation=45)
plt.margins(x=2, y=2)
plt.show()
|
Output:
Share your thoughts in the comments
Please Login to comment...