Matplotlib.pyplot.ion() in Python
Last Updated :
10 Jan, 2024
Matplotlib is an amazing visualization library in Python for 2D plots of arrays. Matplotlib is a multi-platform data visualization library built on NumPy arrays and designed to work with the broader SciPy stack.
The matplotlib.pyplot.ion() is used to turn on interactive mode. To check the status of interactive mode one can run the below commands,
plt.rcParams['interactive']
or, this command
plt.isinteractive()
Matplotlib also interacts with different backends behind the scenes. The workhorse behind rendering charts in Matplotlib is its backends. Some interactive backends dynamically update and pop up to users after every change. By default, the interactive mode is turned off.
Also Read: How to turn off Interactive Mode
Matplotlib.pyplot.ion() Syntax in Python
Syntax : matplotlib.pyplot.ion()
Parameter:
ion() function in pyplot enables interactive mode, automatically updating plots in response to events without explicit commands.
Return type : None
Matplotlib.pyplot.ion() in Python Example
There are various example for use Matplotlib in interactive mode or How to use Matplotlib in interactive mode with Matplotlib.pyplot.ion() . Here we are discussing some generally use example those are following.
Interactive Plot with Collections
In this example code utilizes Matplotlib to generate an interactive plot with two random data collections, represented by red ‘x’ and blue ‘+’ markers. It includes a filled green region between the collections where the second one surpasses the first, and a legend with a colored background is placed at the upper center of the plot.
Python3
import matplotlib.pyplot as plt
plt.ion()
random_array = np.arange(-4, 5)
collection_1 = random_array ** 2
collection_2 = 10 / (random_array ** 2 + 1)
figure, axes = plt.subplots()
axes.plot(random_array, collection_1,
'rx', random_array,
collection_2, 'b+',
linestyle='solid')
axes.fill_between(random_array,
collection_1,
collection_2,
where=collection_2>collection_1,
interpolate=True,
color='green', alpha=0.3)
lgnd = axes.legend(['collection-1',
'collection-2'],
loc='upper center',
shadow=True)
lgnd.get_frame().set_facecolor('#ffb19a')
|
Output:

Interactive Matplotlib Plot with Multiple Lines
In this example The code sets up an interactive Matplotlib plot, plots a line with points (1.4, 2.5), and adds a title. It retrieves the current Axes object and plots another line with points (3.1, 2.2) on the same plot
Python3
import matplotlib.pyplot as plt
plt.ion()
plt.plot([1.4, 2.5])
plt.title(" Sample interactive plot")
axes = plt.gca()
axes.plot([3.1, 2.2])
|
Output:

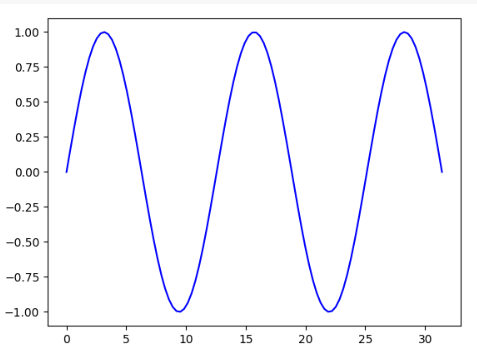
Interactive Matplotlib Plot with draw()
In this example code initializes an interactive Matplotlib plot, creating a sine wave and plotting it in blue. It then iterates through phases, updating the y-data of the sine wave and redrawing the plot, resulting in an animated sine wave with a short pause between frames.
Python3
import matplotlib.pyplot as plt
import numpy as np
x = np.linspace(0, 10 * np.pi, 100)
y = np.sin(x)
plt.ion()
fig, ax = plt.subplots()
line1, = ax.plot(x, y, 'b-')
for phase in np.linspace(0, 10 * np.pi, 100):
line1.set_ydata(np.sin(0.5 * x + phase))
fig.canvas.draw()
plt.pause(0.1)
|
Output :
FAQ’s
Matplotlib ion() function fails to be interactive , Why ?
The `matplotlib.pyplot.ion()` function may fail to make plots interactive due to potential conflicts with other plotting libraries or backend issues. Ensure that it is called in the correct sequence, and consider checking for any conflicting code or configurations in your environment.
How to use Matplotlib in interactive mode?
To use Matplotlib in interactive mode, invoke `plt.ion()` before creating plots. This enables real-time updates to the plots, allowing dynamic changes. To turn off interactive mode, use `plt.ioff()` or close the plot window.
Matplotlib plot not showing with plt.ion() in a python script, but working in python shell , Why ?
The issue with `plt.ion()` not showing plots in a script but working in the shell may be due to the script finishing quickly. Add a delay or an input function at the end of the script to keep it running, allowing the plot to be displayed before termination.
Like Article
Suggest improvement
Share your thoughts in the comments
Please Login to comment...