Matplotlib.pyplot.figtext() in Python
Last Updated :
19 Apr, 2020
Matplotlib is an extensively used Python library for data visualization. It is a multi-platform data visualization library built on NumPy arrays, also designed to work with the SciPy stack.
Matplotlib.pyplot.figtext()
Figtext is used to add text to a figure at any location on it. You can even add the text outside the Axes. It uses the complete figure for co-ordinates, where bottom-left denotes (0, 0) and top right represents (1, 1). The centre of the figure is (0.5, 0.5).
Syntax:
matplotlib.pyplot.figtext(x, y, s, *args, **kwargs)
| Parameter |
Values |
Use |
| x, y |
Float |
Position to place the text. It is by default in figure coordinates [0, 1] |
| s |
String |
Text String |
Example #1: A sample example demonstrating the use of figtext.
import matplotlib.pyplot as plt
import numpy as np
x = np.arange(0, 8, 0.1)
y = np.sin(x)
plt.plot(x, y)
plt.figtext(0, 0, "This is a sample example \
explaining figtext", fontsize = 10)
plt.xlabel('x')
plt.ylabel('y')
plt.show()
|
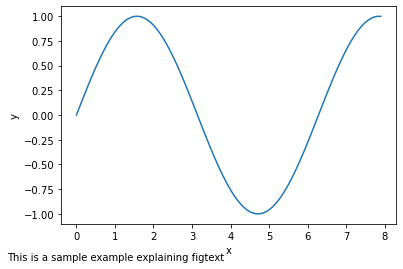
The above example places text on the bottom left of the figure of the given font size.
Example #2: We can also place text at a relative position in the figure by adjusting the values of x and y.
import matplotlib.pyplot as plt
import numpy as np
x = np.arange(0, 8, 0.1)
y = np.sin(x)
plt.plot(x, y)
plt.figtext(0.55, 0.7,
"Sin curve",
horizontalalignment ="center",
verticalalignment ="center",
wrap = True, fontsize = 14,
color ="green")
plt.xlabel('x')
plt.ylabel('y')
plt.show()
|
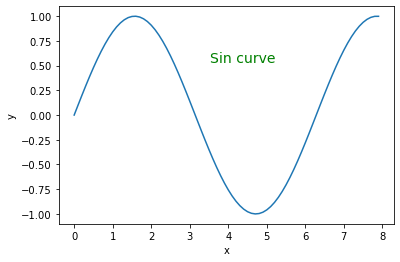
Alignment arguments- horizontalalignment and verticalalignment place the text in the centre while the wrap argument makes sure that the text lies within the figure width. The color argument gives the font color.
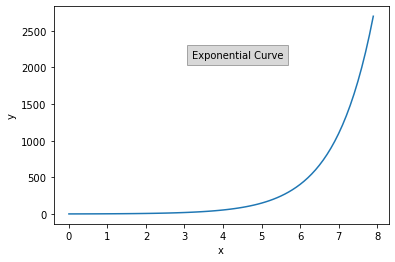
Example #3: We can also add a bounding box around the text by using the bbox argument.
import matplotlib.pyplot as plt
import numpy as np
x = np.arange(0, 8, 0.1)
y = np.exp(x)
plt.plot(x, y)
plt.figtext(0.55, 0.7,
"Exponential Curve",
horizontalalignment ="center",
wrap = True, fontsize = 10,
bbox ={'facecolor':'grey',
'alpha':0.3, 'pad':5})
plt.xlabel('x')
plt.ylabel('y')
plt.show()
|
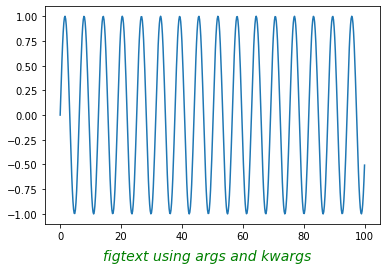
Example #4: We can also use *args and **kwargs to add text properties to our plot. *args and **kwargs are used to pass multiple arguments or keyword arguments to a function.
Note: For more info refer to the article: *args and **kwargs in Python
import numpy as np
import matplotlib.pyplot as plt
x = np.linspace(0, 100, 501)
y = np.sin(x)
figtext_args = (0.5, 0,
"figtext using args and kwargs")
figtext_kwargs = dict(horizontalalignment ="center",
fontsize = 14, color ="green",
style ="italic", wrap = True)
plt.plot(x, y)
plt.figtext(*figtext_args, **figtext_kwargs)
plt.show()
|
Like Article
Suggest improvement
Share your thoughts in the comments
Please Login to comment...