Matplotlib.pyplot.eventplot() in Python
Last Updated :
19 Apr, 2020
Matplotlib is an amazing visualization library in Python for 2D plots of arrays. Matplotlib is a multi-platform data visualization library built on NumPy arrays and designed to work with the broader SciPy stack.
Matplotlib.pyplot.eventplot()
This function is often used to plot identical lines at a given position. These plots, in general, are used for representing neural events in neuroscience, where more often it is called spike raster or dot raster or raster plot. More often it is also used for showing the timing or positioning of multiple sets of different or discrete events. For instance the arrival times of employees each day to a business every month or date of hurricanes every year for the last decade or century.
Syntax:: matplotlib.pyplot.eventplot(positions, orientation=’vertical’, lineoffsets=2, linelengths=2, linewidth= None, colors= None, linestyles=’solid’, *, data= None, **kwargs)
Parameters :
- Positions: This parameter is generally a 1D or D array-like object where each value in the array represents an event. For a 2D array like position, each row corresponds to either a row or a column of the line which depends upon the orientation parameter. It is a required parameter for this method.
- orientation: It is an optional argument which takes two values either ‘horizontal’ or ‘vertical’. It is responsible for controlling the direction of the event collections. If the passed value of orientation is ‘horizontal’ the lines are arranged horizontally in rows and are vertical whereas if the passed value is ‘vertical’ the lines are arranged vertically in columns and are horizontal
- lineoffsets: This is an optional argument whose default value is 1. This parameter is used for plotting offset of the center of lines starting from the origin, which are orthogonal to the orientation of the plot. It accepts a scalar or sequence of scalars as its values.
- linelengths: Similar to lineoffsets it is also an optional parameter whose default value is 1 and accepts scalar or a scalar sequence as its value. It is used to set the total height of the lines. It sets the stretches of the lines from lineoffset – linelength/2 to lineoffset + linelength/2.
- linewidths: It is an optional parameter whose default value is None. It accepts scalar or scalar sequence or None as values. It is used to set the line width(s) of event lines in points. If it is set to None it defaults to its rcParams setting.
- colors: As the name suggests it is used to set the colors of the event lines. It is an optional parameter whose default value is None. If the value is None it defaults to its rcParams setting. It takes color, the sequence of colors or None as a value.
- linestyles: It is an optional parameter that takes a string, tuple or a sequence of strings or tuples as its value. The default value for this parameter is ‘solid’. The valid strings for this parameter are [‘solid’, ‘dashed’, ‘dashdot’, ‘dotted’, ‘-‘, ‘–‘, ‘-.’, ‘:’]. The dash tuples need to be in the form of (offset, onoffseq) where onoffseq is a tuple of on and off ink in points of even lengths.
- **kwargs: It is an optional parameter. It generally accepts keywords from LineCollection properties.
Return:
This method returns a list of EventCollection objects which contains the EventCollection that were added.
Note: It is important to note that for linelengths, linewidths, colors, and linestyles, if only a single value is provided than those values are applied to all lines whereas for an array-like value it is important that it has the same length as positions and each value is applied to the corresponding row of the array.
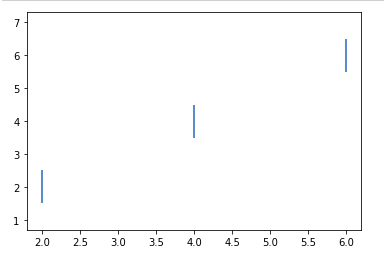
Example 1:
import numpy as np
import matplotlib.pyplot as plt
positions = np.array([2, 4, 6])[:,np.newaxis]
offsets = [2,4,6]
plt.eventplot(positions, lineoffsets=offsets)
plt.show()
|
Output:
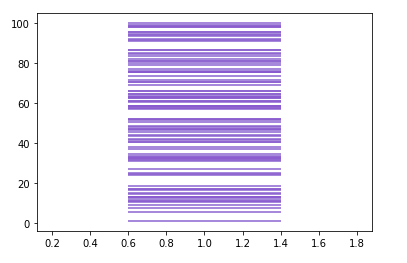
Example 2:
import numpy as np
import matplotlib.pyplot as plt
spike = 100*np.random.random(100)
plt.eventplot(spike,
orientation = 'vertical',
linelengths = 0.8,
color = [(0.5,0.5,0.8)])
|
Output:
Like Article
Suggest improvement
Share your thoughts in the comments
Please Login to comment...