Matplotlib.pyplot.barbs() in Python
Last Updated :
21 Apr, 2020
Matplotlib is a library of Python bindings which provides the user with a MATLAB-like plotting framework. Matplotlib can be used in Python scripts, the Python and IPython shell, web application servers, and various graphical user interface toolkits like Tkinter, awxPython, etc.
Note: For more information, refer to Python Matplotlib – An Overview
Matplotlib.pyplot.barbs()
matplotlib.pyplot.barbs method is used to plot a 2D field of barbs.
What are barbs?
Barbs are used majorly in meteorology to plot the speed and direction of winds, but can be used to plot any two-dimensional vector quantity. Barbs are able to provide more precise and quantitative information about vector magnitude when compared to arrows. This is mainly because arrows use their length to give a sense of the magnitude of the vector, while barbs use triangles or slanted lines as shown below:
                   /\    \
                  /  \    \
                 /    \    \    \
                /      \    \    \
               ------------------------------
- The largest increment in magnitude is denoted by a triangle (or flag)
- The smallest increment is a half-line
Syntax : matplotlib.pyplot.barbs(x_coordinate, y_coordinate, x_direction, y_direction, [colour])
Parameters:
x_coordinate : x-coordinate of the barb location
(may be a 2-dimensional array in case of multiple barbs)
y_coordinate : y-coordinate of the barb location
(may be a 2-dimensional array in case of multiple barbs)
x_direction : x-component of the direction of barb shaft
(may be a 2-dimensional array in case of multiple barbs)
y_direction : y-component of the direction of the barb shaft
(may be a 2-dimensional array in case of multiple barbs)
colour (optional): specifies the colour of the barb in the graph
Optional Parameters
length : length of the barb in points, other parts of the barb are scaled against this
pivot : part of the barb anchored to the grid; the barb rotates about this point. Maybe a number, which shifts the barb that many points away from the grid point
Return Value : Returns a 2D graph with arrows plotted
Note :
- If the x-coordinate and y-coordinate of the barb locations are not given, they will be generated as a uniform integer meshgrid based on x_direction and y_direction
- If x-coordinate and y-coordinate are one-dimensional but x_direction and y_direction are two-dimensional, then x-coordinate and y-coordinate would be expanded to a two-dimensional meshgrid using
x, y=numpy.meshgrid(x, y). In this case, the lengths of x-coordinate and y-coordinate must match the row and column dimensions of x_direction and y_direction
Sample Code:
import matplotlib.pyplot as plt
import numpy as np
x = np.linspace(-5, 5, 5)
X, Y = np.meshgrid(x, x)
U, V = 12 * X, 12 * Y
data = [(-1.5, .5, -6, -6),
(1, -1, -46, 46),
(-3, -1, 11, -11),
(1, 1.5, 80, 80),
(0.5, 0.25, 25, 15),
(-1.5, -0.5, -5, 40)]
data = np.array(data, dtype=[('x', np.float32),
('y', np.float32),
('u', np.float32),
('v', np.float32)])
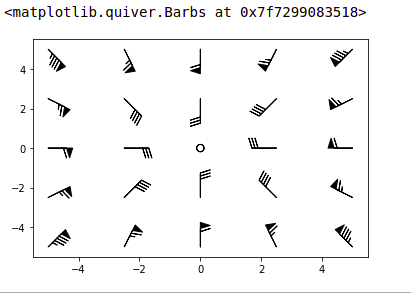
plt.barbs(X, Y, U, V)
|
Output :
Like Article
Suggest improvement
Share your thoughts in the comments
Please Login to comment...