Matplotlib.pyplot.axvspan() in Python
Last Updated :
12 Apr, 2020
Matplotlib is a plotting library for creating static, animated, and interactive visualizations in Python.\ Pyplot is a Matplotlib module which provides a MATLAB-like interface. Matplotlib is designed to be as usable as MATLAB, with the ability to use Python and the advantage of being free and open-source.
matplotlib.pyplot.axvspan()
This function sets the vertical rectangle across the axes of the plot
Syntax: matplotlib.pyplot.axvspan(xmin, xmax, ymin=0, ymax=1, **kwargs)
Parameters:
xmin :Number indicating the starting position of the vertical rectangle on X-axis
xmin :Number indicating the ending position of the vertical rectangle on X-axis
ymin :vertical rectangle starting position on y axis, it will take values between 0 and 1, 0 being bottom of the axis, 1 being top of the axis
ymax :vertical rectangle ending position on y axis, it will take values between 0 and 1, 0 being bottom of the axis, 1 being top of the axis
**kwargs :Other optional parameters to change the properties of the rectangle, like changing color etc.
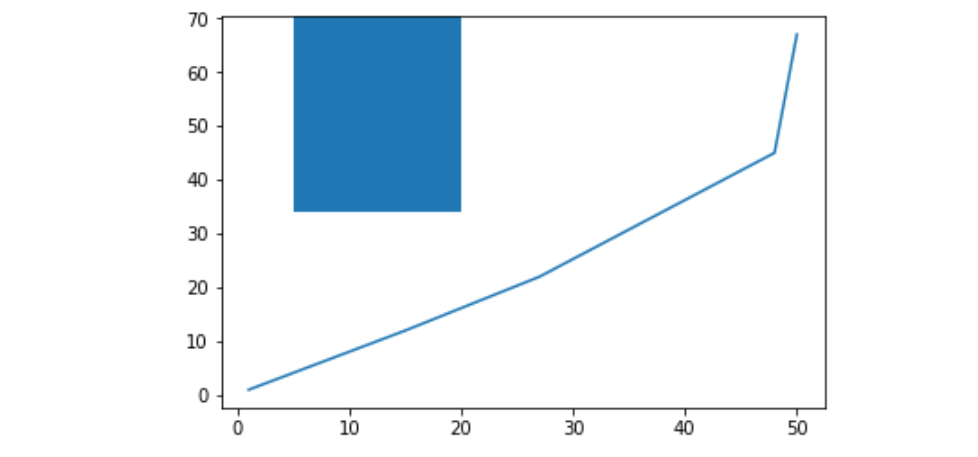
Example #1:
import matplotlib.pyplot as plt
x =[1, 15, 27, 48, 50]
y =[1, 12, 22, 45, 67]
plt.plot(x, y)
plt.axvspan(5, 20, ymin = 0.5, ymax = 1)
plt.show()
|
Output:
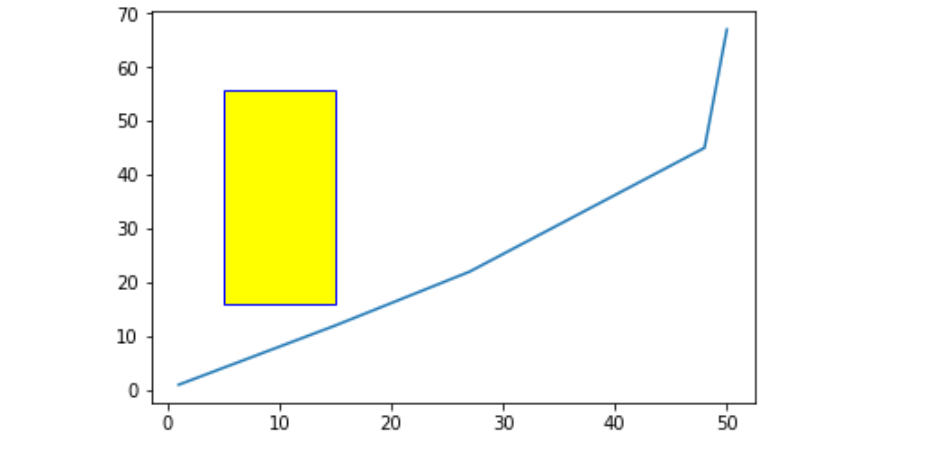
Example #2:
import matplotlib.pyplot as plt
x =[1, 15, 27, 48, 50]
y =[1, 12, 22, 45, 67]
plt.plot(x, y)
plt.axvspan(5, 15, ymin = 0.25,
ymax = 0.80, ec ='blue',
color ='yellow')
plt.show()
|
Output :
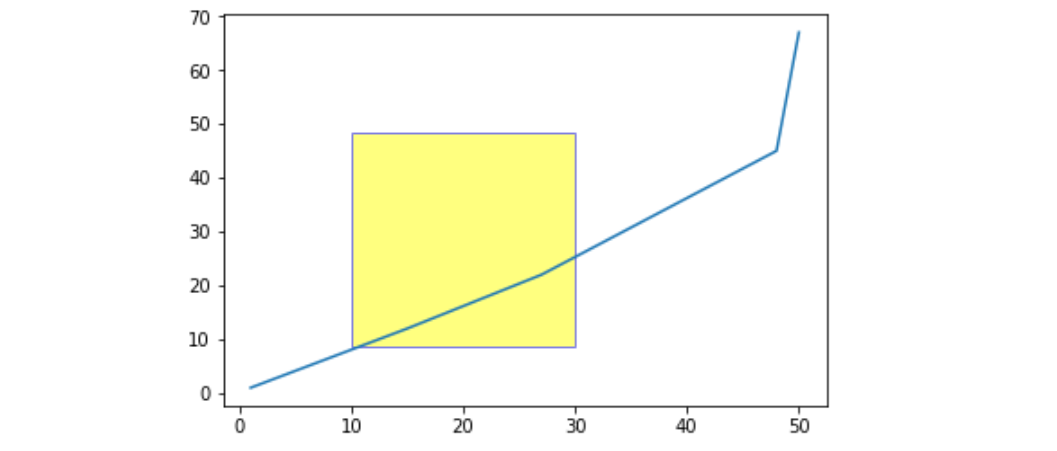
Example #3:
import matplotlib.pyplot as plt
x =[1, 15, 27, 48, 50]
y =[1, 12, 22, 45, 67]
plt.plot(x, y)
plt.axvspan(10, 30, ymin = 0.15,
ymax = 0.70, ec ='blue',
color ='yellow',
alpha = 0.5)
plt.show()
|
Output :
Like Article
Suggest improvement
Share your thoughts in the comments
Please Login to comment...