Matplotlib.pyplot.axis() in Python
Last Updated :
12 Apr, 2020
Matplotlib is a plotting library for creating static, animated, and interactive visualizations in Python. Pyplot is a Matplotlib module which provides a MATLAB-like interface. Matplotlib is designed to be as usable as MATLAB, with the ability to use Python and the advantage of being free and open-source.
matplotlib.pyplot.axis()
This function is used to set some axis properties to the graph.
Syntax: matplotlib.pyplot.axis(*args, emit=True, **kwargs)
Parameters:
xmin, xmax, ymin, ymax:These parameters can be used to
set the axis limits on the graph
emit:Its a bool value used to notify observers of the axis limit change
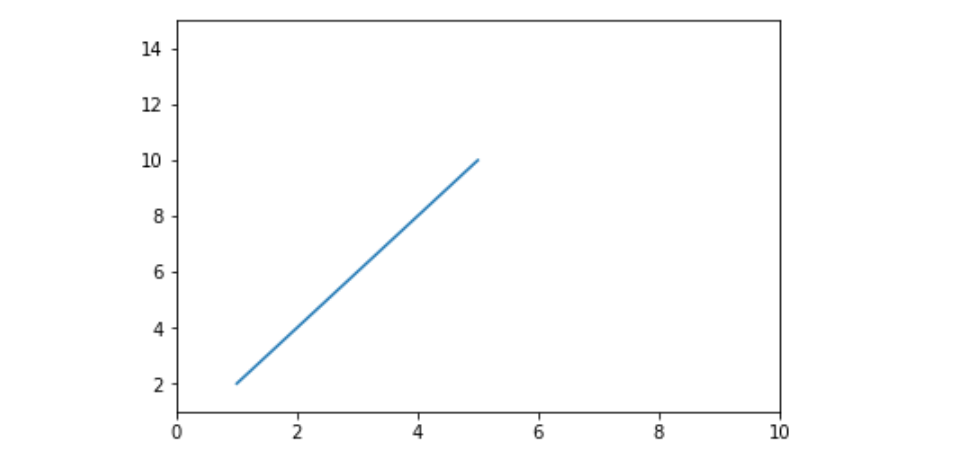
Example #1:
import matplotlib.pyplot as plt
x =[1, 2, 3, 4, 5]
y =[2, 4, 6, 8, 10]
plt.plot(x, y)
plt.axis([0, 10, 1, 15])
plt.show()
|
Output:
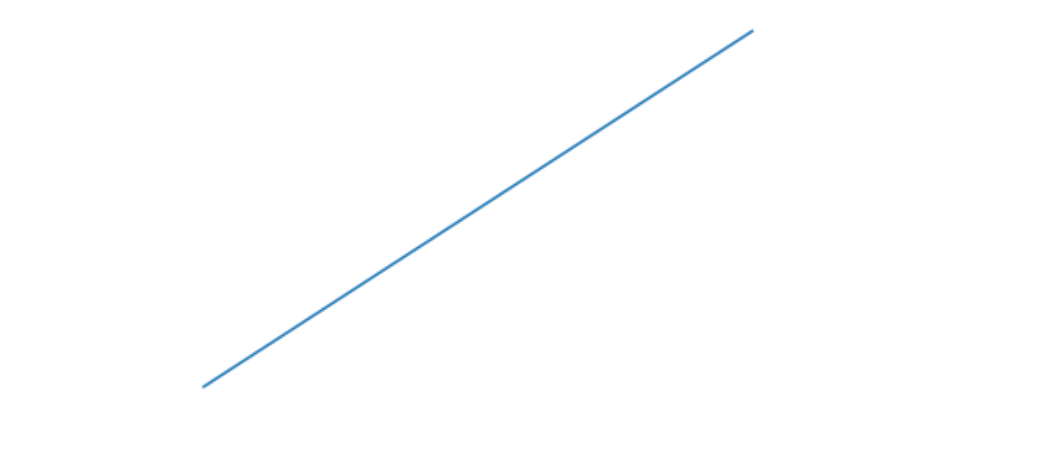
Example #2:
import matplotlib.pyplot as plt
x =[1, 2, 3, 4, 5]
y =[2, 4, 6, 8, 10]
plt.plot(x, y)
plt.axis('off')
plt.show()
|
Output:
Like Article
Suggest improvement
Share your thoughts in the comments
Please Login to comment...