matplotlib.pyplot.arrow() in Python
Last Updated :
20 Jul, 2021
Matplotlib is a very powerful plotting library useful for those working with Python and NumPy. And for making statistical interference, it becomes very necessary to visualize our data and Matplotlib is the tool that can be very helpful for this purpose. It provides MATLAB like interface only difference is that it uses Python and is open source.
matplotlib.pyplot.arrow()
This function adds the arrow to the graph based on the coordinates passed to it.
Syntax: matplotlib.pyplot.arrow(x, y, dx, dy, **kwargs)
Parameters:
x, y: The x and y coordinates of the arrow base.
dx, dy: The length of the arrow along x and y direction.
**kwargs: Optional arguments that helps in adding properties to arrow, like
adding color to arrow, changing width of arrow
Example #1
Python3
import matplotlib.pyplot as plt
x =[1, 2, 3, 4, 5]
y =[2, 4, 6, 8, 10]
plt.plot(x, y)
plt.arrow(2, 4, 2, 2, width = 0.05)
plt.show()
|
Output:

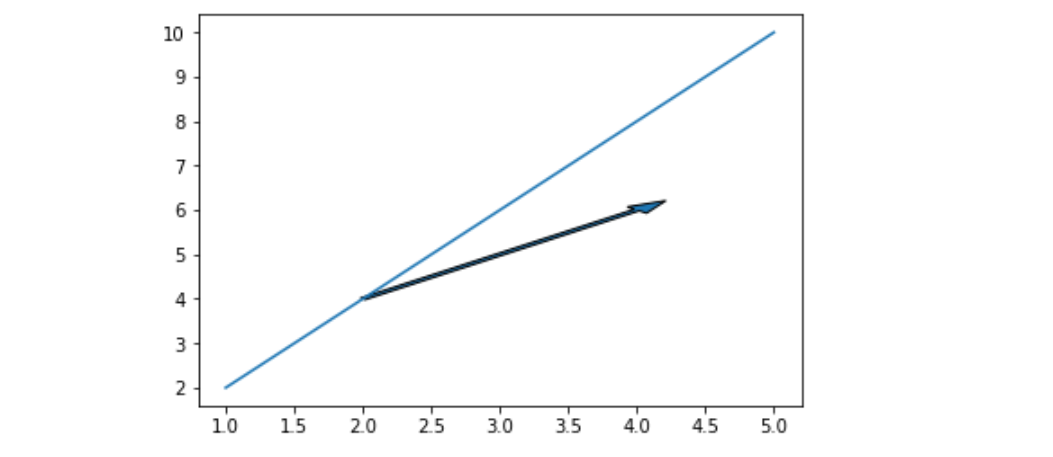
Example 2#
Python3
import matplotlib.pyplot as plt
x =[1, 2, 3, 4, 5]
y =[2, 4, 6, 8, 10]
plt.plot(x, y)
plt.arrow(2, 4, 2, 2,
head_width = 0.2,
width = 0.05)
plt.show()
|
Output:
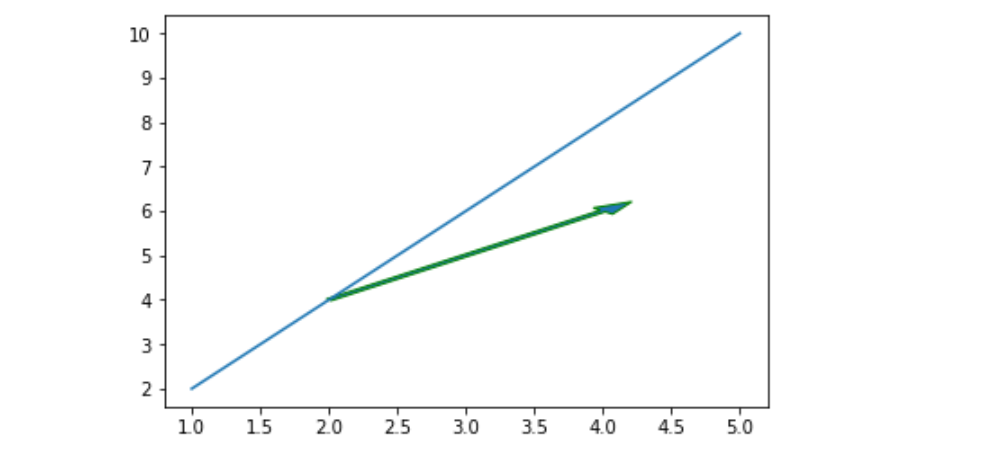
Example #3
Python3
import matplotlib.pyplot as plt
x =[1, 2, 3, 4, 5]
y =[2, 4, 6, 8, 10]
plt.plot(x, y)
plt.arrow(2, 4, 2, 2,
head_width = 0.2,
width = 0.05,
ec ='green')
plt.show()
|
Output:
Like Article
Suggest improvement
Share your thoughts in the comments
Please Login to comment...