Matplotlib.pyplot.acorr() in Python
Last Updated :
12 Apr, 2020
Matplotlib is a library in Python and it is numerical – mathematical extension for NumPy library. Pyplot is a state-based interface to a Matplotlib module which provides a MATLAB-like interface.
matplotlib.pyplot.acorr() Function
The acorr() function in pyplot module of matplotlib library is used to plot the autocorrelation of x (array-like).
Syntax: matplotlib.pyplot.acorr(x, *, data=None, **kwargs)
Parameters: This method accept the following parameters that are described below:
- x: This parameter is a sequence of scalar.
- detrend: This parameter is an optional parameter. Its default value is mlab.detrend_none
- normed: This parameter is also an optional parameter and contains the bool value. Its default value is True
- usevlines: This parameter is also an optional parameter and contains the bool value. Its default value is True
- maxlags: This parameter is also an optional parameter and contains the integer value. Its default value is 10
- linestyle: This parameter is also an optional parameter and used for plotting the data points, only when usevlines is False.
- marker: This parameter is also an optional parameter and contains the string. Its default value is ‘o’
Returns: This method returns the following:
- lags:This method returns the lag vector
- c:This method returns the auto correlation vector.
- line : Added LineCollection if usevlines is True, otherwise add Line2D.
- b: This method returns the horizontal line at 0 if usevlines is True, otherwise None.
The resultant is (lags, c, line, b).
Below examples illustrate the matplotlib.pyplot.acorr() function in matplotlib.pyplot:
Example #1:
import matplotlib.pyplot as plt
import numpy as np
geeks = np.array([24.40, 110.25, 20.05, 22.00,
61.90, 7.80, 15.00, 22.80,
34.90, 57.30])
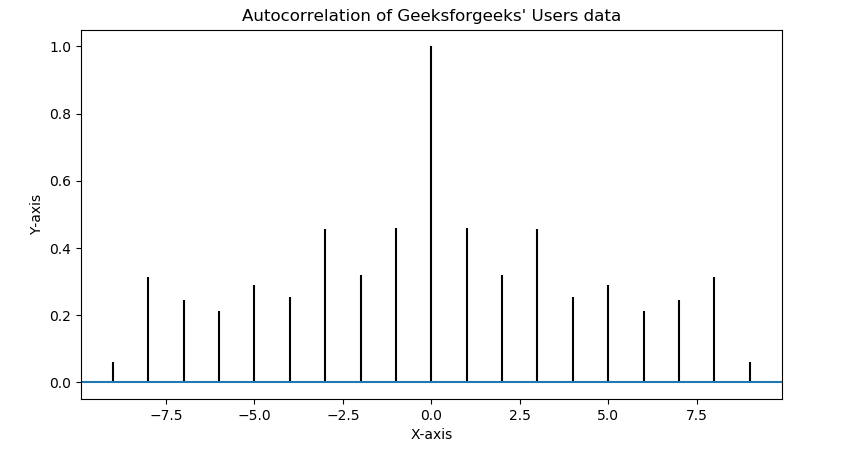
plt.acorr(geeks, maxlags = 9)
plt.title("Autocorrelation of Geeksforgeeks' Users data")
plt.xlabel('X-axis')
plt.ylabel('Y-axis')
plt.show()
|
Output:
Example #2:
import matplotlib.pyplot as plt
import numpy as np
np.random.seed(10**7)
geeks = np.random.randn(51 )
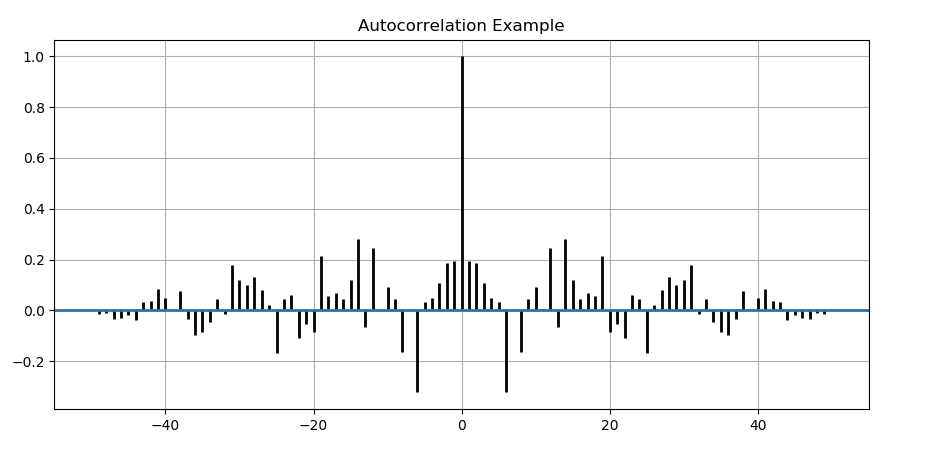
plt.title("Autocorrelation Example")
plt.acorr(geeks, usevlines = True,
normed = True, maxlags = 50,
lw = 2)
plt.grid(True)
plt.show()
|
Output:
Share your thoughts in the comments
Please Login to comment...