Matplotlib.figure.Figure.tight_layout() in Python
Last Updated :
03 May, 2020
Matplotlib is a library in Python and it is numerical – mathematical extension for NumPy library. The figure module provides the top-level Artist, the Figure, which contains all the plot elements. This module is used to control the default spacing of the subplots and top level container for all plot elements.
matplotlib.figure.Figure.tight_layout() method
The tight_layout() method figure module of matplotlib library is used to automatically adjust subplot parameters to give specified padding.
Syntax: tight_layout(self, renderer=None, pad=1.08, h_pad=None, w_pad=None, rect=None)
Parameters: This method accept the following parameters that are discussed below:
- renderer : This parameter is the subclass of RendererBase.
- pad: This parameter is used for padding between the figure edge and the edges of subplots, as a fraction of the font size.
- h_pad, w_pad: These parameter are used for padding (height/width) between edges of adjacent subplots, as a fraction of the font size.
- rect: This parameter is rectangle in the normalized figure coordinate that the whole subplots area will fit into.
Returns: This method does not returns any value.
Below examples illustrate the matplotlib.figure.Figure.tight_layout() function in matplotlib.figure:
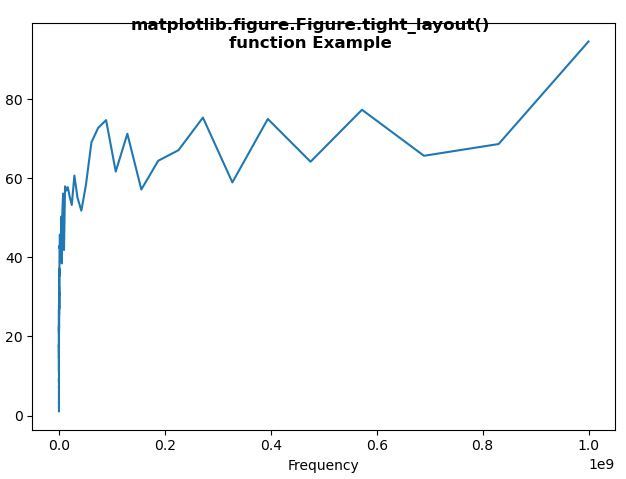
Example 1:
import matplotlib.pyplot as plt
import numpy as np
from matplotlib.ticker import EngFormatter
prng = np.random.RandomState(19680801)
xs = np.logspace(1, 9, 100)
ys = (0.8 + 0.4 * prng.uniform(size = 100)) * np.log10(xs)**2
plt.xscale('log')
fig = plt.figure()
ax = fig.subplots()
formatter0 = EngFormatter(unit ='Hz')
ax.plot(xs, ys)
ax.set_xlabel('Frequency')
fig.tight_layout()
fig.suptitle(
, fontweight ="bold")
fig.show()
|
Output:
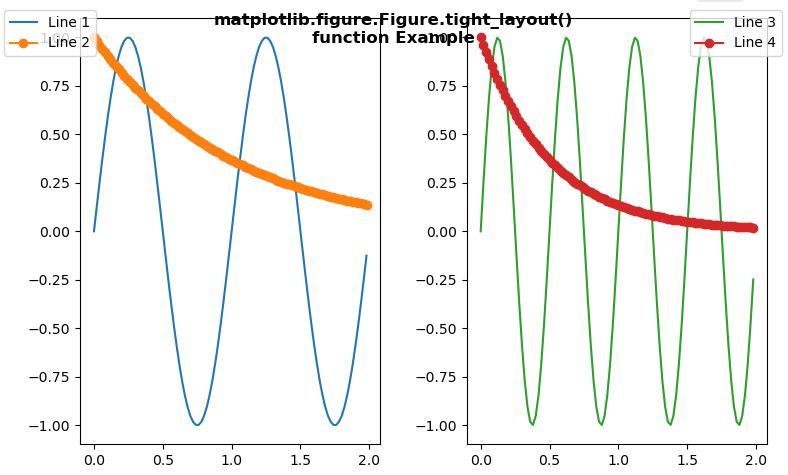
Example 2:
import numpy as np
import matplotlib.pyplot as plt
fig, axs = plt.subplots(1, 2)
x = np.arange(0.0, 2.0, 0.02)
y1 = np.sin(2 * np.pi * x)
y2 = np.exp(-x)
l1, = axs[0].plot(x, y1)
l2, = axs[0].plot(x, y2, marker ='o')
y3 = np.sin(4 * np.pi * x)
y4 = np.exp(-2 * x)
l3, = axs[1].plot(x, y3, color ='tab:green')
l4, = axs[1].plot(x, y4, color ='tab:red', marker ='o')
fig.legend((l1, l2), ('Line 1', 'Line 2'), 'upper left')
fig.legend((l3, l4), ('Line 3', 'Line 4'), 'upper right')
fig.tight_layout()
fig.suptitle(
, fontweight ="bold")
fig.show()
|
Output:
Like Article
Suggest improvement
Share your thoughts in the comments
Please Login to comment...