Matplotlib.figure.Figure.add_gridspec() in Python
Last Updated :
30 Apr, 2020
Matplotlib is a library in Python and it is numerical – mathematical extension for NumPy library. The figure module provides the top-level Artist, the Figure, which contains all the plot elements. This module is used to control the default spacing of the subplots and top level container for all plot elements.
matplotlib.figure.Figure.add_gridspec() function
The add_gridspec() method figure module of matplotlib library is used to get the GridSpec that has this figure as a parent.
Syntax: add_gridspec(self, nrows, ncols, **kwargs)
Parameters: This accept the following parameters that are described below:
- nrows : This parameter is the number of rows in grid.
- ncols : This parameter is the number or columns in grid.
Returns: This method return the GridSpec.
Below examples illustrate the matplotlib.figure.Figure.add_gridspec() function in matplotlib.figure:
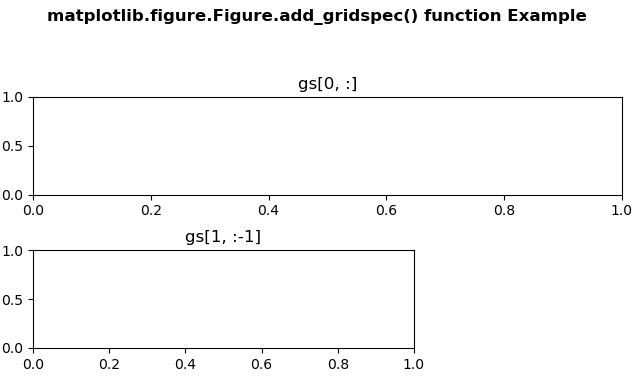
Example 1:
import matplotlib
import matplotlib.pyplot as plt
import matplotlib.gridspec as gridspec
fig = plt.figure(constrained_layout = True)
gs = fig.add_gridspec(3, 3)
ax = fig.add_subplot(gs[0, :])
ax.set_title('gs[0, :]')
ax2 = fig.add_subplot(gs[1, :-1])
ax2.set_title('gs[1, :-1]')
fig.suptitle('matplotlib.figure.Figure.add_gridspec() \
function Example\n\n', fontweight ="bold")
plt.show()
|
Output:
Example 2:
import matplotlib
import matplotlib.pyplot as plt
import matplotlib.gridspec as gridspec
fig = plt.figure()
gs = fig.add_gridspec(2, 2)
ax1 = fig.add_subplot(gs[0, 0])
ax2 = fig.add_subplot(gs[1, 0])
ax3 = fig.add_subplot(gs[:, 1])
fig.suptitle('matplotlib.figure.Figure.add_gridspec()\
function Example\n\n', fontweight ="bold")
plt.show()
|
Output:

Like Article
Suggest improvement
Share your thoughts in the comments
Please Login to comment...