Matplotlib – Checkbox Widget
Last Updated :
24 Feb, 2021
In this article, We are going to see the use of these checkboxes in matplotlib plots to make our plot more interactive. Checkbox widget offers us the freedom to make our plot more interactive. By using checkboxes we can perform on-tick events which on ticking the checkbox will trigger some event.
We will use the interact() function in ipywidgets library, to create checkboxes. The interact function automatically creates user interface (UI) controls for exploring code and data interactively. It accepts two parameters; a custom function and a Boolean keyword argument using which it generates autogenerate UI controls for a checkbox.
Approach:
We will be plotting the graph of the exponential curve in a range of (0,5). For that, we’ve created a hundred points (x-values) in the range 0-5 and then generate its corresponding exponential value using the NumPy.exp() function. As discussed earlier, Now created a custom function named plot() which accepts the Boolean value passed in the interact() function. Based upon the Boolean value either True or False, the checkbox is triggered.
When the passed parameter is set to False, then the checkbox is not clicked by default and a simple line plot of the exponential curve will be displayed. When the passed parameter is set to True, then the checkbox is clicked, and the scatter plot of the exponential curve gets displayed.
Code:
Python
import numpy as np
import matplotlib.pyplot as plt
from ipywidgets import interact
%matplotlib inline
x = np.linspace(0, 5, 100)
y = np.exp(x)
def plot(checkbox):
if checkbox:
plt.scatter(x, y, s = 5)
plt.title('Scatter plot of exponential curve')
else:
plt.plot(x, y)
plt.title('Line plot of exponential curve')
interact(plot, checkbox = bool())
|
Output:
When the checkbox is not clicked by default Boolean value is set to False and the line plot will be displayed.
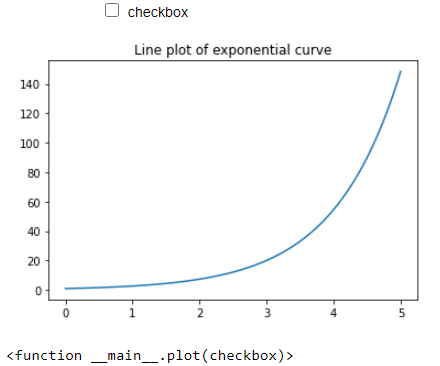
Checkbox not ticked: line plot
When the checkbox is ticked Boolean value inside the interact() function is set to True and a scatter plot will be displayed.
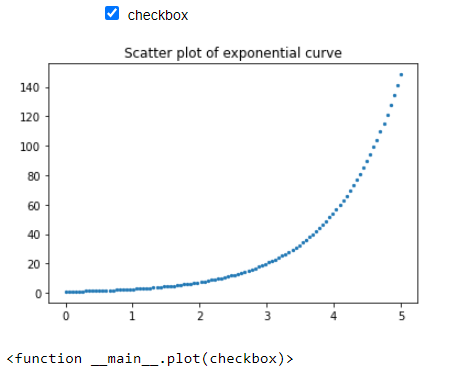
checkbox ticked: scatter plot
Like Article
Suggest improvement
Share your thoughts in the comments
Please Login to comment...