Matplotlib.axis.Tick.remove() function in Python
Last Updated :
10 Jun, 2020
Matplotlib is a library in Python and it is numerical – mathematical extension for NumPy library. It is an amazing visualization library in Python for 2D plots of arrays and used for working with the broader SciPy stack.
Matplotlib.axis.Tick.remove() Function
The Tick.remove() function in axis module of matplotlib library is used to remove the artist from the figure if possible.
Syntax: Tick.remove(self)
Parameters: This method does not accepts any parameter.
Return value: This method return the figure after removal of the artist.
Below examples illustrate the matplotlib.axis.Tick.remove() function in matplotlib.axis:
Example 1:
Python3
from matplotlib.axis import Tick
import matplotlib.pyplot as plt
fig, axs = plt.subplots()
axs.plot([1, 2, 3])
Tick.remove(axs)
fig.suptitle('matplotlib.axis.Tick.remove() \
function Example', fontweight ="bold")
plt.show()
|
Output:
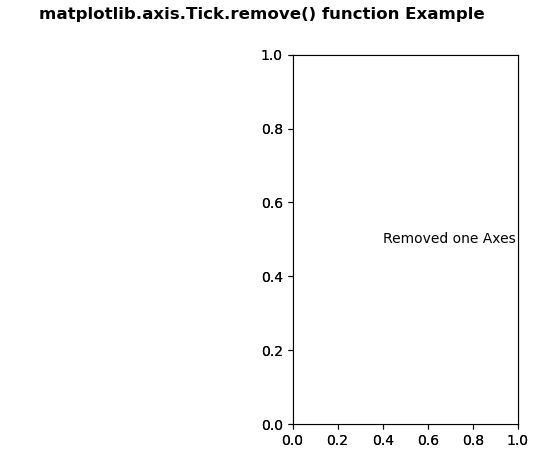
Example 2:
Python3
from matplotlib.axis import Tick
import matplotlib.pyplot as plt
fig, (axs, axs2) = plt.subplots(1, 2)
gs = axs2.get_gridspec()
Tick.remove(axs)
axbig = fig.add_subplot(gs[0:, -1])
axbig.annotate("Removed one Axes",
(0.4, 0.5),
xycoords ='axes fraction',
va ='center')
fig.suptitle('matplotlib.axis.Tick.remove() \
function Example', fontweight ="bold")
plt.show()
|
Output:
Like Article
Suggest improvement
Share your thoughts in the comments
Please Login to comment...