Matplotlib.axis.Axis.zoom() function in Python
Last Updated :
08 Jun, 2020
Matplotlib is a library in Python and it is numerical – mathematical extension for NumPy library. It is an amazing visualization library in Python for 2D plots of arrays and used for working with the broader SciPy stack.
Matplotlib.axis.Axis.zoom() Function
The Axis.zoom() function in axis module of matplotlib library is used to zoom in or out on axis .
Syntax: Axis.zoom(self, direction)
Parameters: This method accepts the following parameters.
- direction: This parameter is the value to zoom in (direction > 0) or zoom out (direction <= 0).
Return value: This method does not return any value.
Below examples illustrate the matplotlib.axis.Axis.zoom() function in matplotlib.axis:
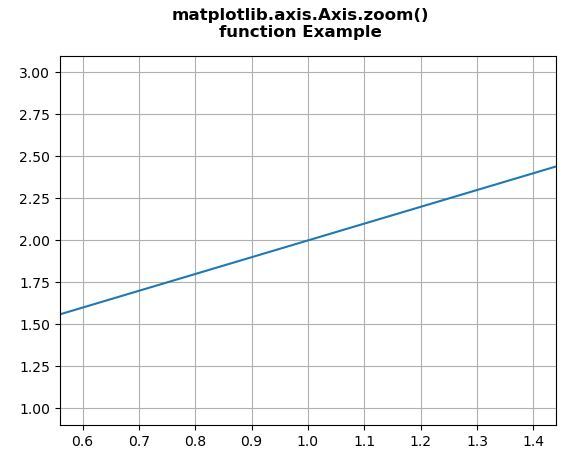
Example 1:
Python3
from matplotlib.axis import Axis
import matplotlib.pyplot as plt
import numpy as np
fig, ax = plt.subplots()
ax.plot([1, 2, 3])
ax.xaxis.zoom(3)
ax.grid()
fig.suptitle(
, fontweight ="bold")
plt.show()
|
Output:
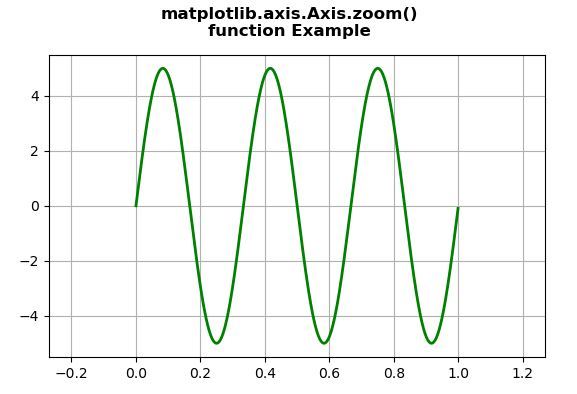
Example 2:
Python3
from matplotlib.axis import Axis
import numpy as np
import matplotlib.pyplot as plt
from matplotlib.widgets import Slider, Button, RadioButtons
fig, ax1 = plt.subplots()
plt.subplots_adjust(bottom = 0.25)
t = np.arange(0.0, 1.0, 0.001)
a0 = 5
f0 = 3
delta_f = 5.0
s = a0 * np.sin(2 * np.pi * f0 * t)
ax1.plot(t, s, lw = 2, color = 'green')
ax1.xaxis.zoom(-2)
ax1.grid()
fig.suptitle(
, fontweight ="bold")
plt.show()
|
Output:
Like Article
Suggest improvement
Share your thoughts in the comments
Please Login to comment...