Matplotlib.axis.Axis.draw() function in Python
Last Updated :
08 Jun, 2020
Matplotlib is a library in Python and it is numerical – mathematical extension for NumPy library. It is an amazing visualization library in Python for 2D plots of arrays and used for working with the broader SciPy stack.
Matplotlib.axis.Axis.draw() Function
The Axis.draw() function in axis module of matplotlib library is used to draw the axis lines, grid lines, tick lines and labels.
Syntax: Axis.draw(self, renderer, \*args, \*\*kwargs)
Parameters: This method accepts the following parameters.
- renderer: This parameter is the RendererBase subclass.
Return value: This method does not return any value.
Below examples illustrate the matplotlib.axis.Axis.draw() function in matplotlib.axis:
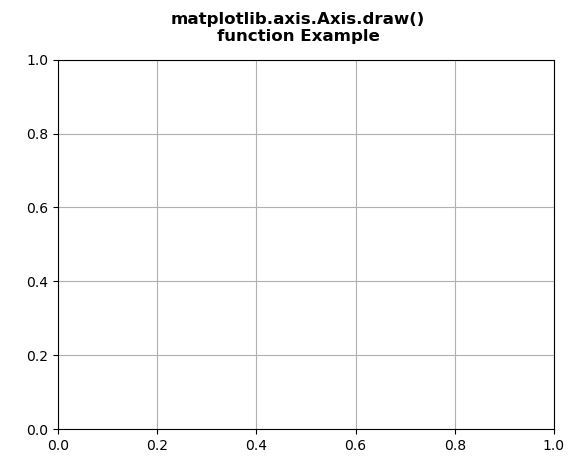
Example 1:
Python3
from matplotlib.axis import Axis
from mpl_toolkits.mplot3d import axes3d
import matplotlib.pyplot as plt
fig, ax = plt.subplots()
def tellme(s):
fig.canvas.draw()
renderer = fig.canvas.renderer
Axis.draw(ax, renderer)
ax.grid()
fig.suptitle(
, fontweight ="bold")
plt.show()
|
Output:
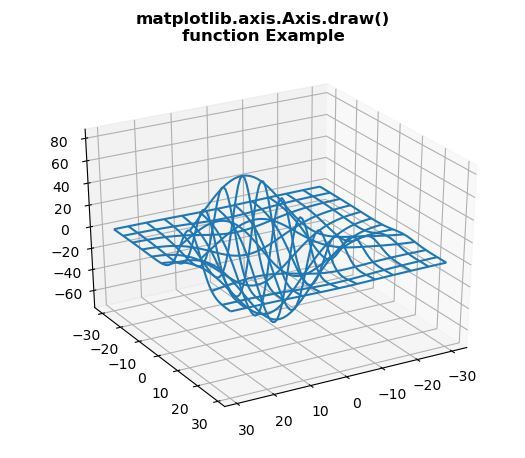
Example 2:
Python3
from matplotlib.axis import Axis
from mpl_toolkits.mplot3d import axes3d
import matplotlib.pyplot as plt
fig = plt.figure()
ax = fig.add_subplot(111, projection ='3d')
X, Y, Z = axes3d.get_test_data(0.1)
ax.plot_wireframe(X, Y, Z, rstride = 5,
cstride = 5)
ax.view_init(30, 60)
fig.canvas.draw()
renderer = fig.canvas.renderer
ax.draw(renderer)
ax.grid()
fig.suptitle(
, fontweight ="bold")
plt.show()
|
Output:
Like Article
Suggest improvement
Share your thoughts in the comments
Please Login to comment...