Matplotlib.axes.Axes.update() in Python
Last Updated :
30 Apr, 2020
Matplotlib is a library in Python and it is numerical – mathematical extension for NumPy library. The Axes Class contains most of the figure elements: Axis, Tick, Line2D, Text, Polygon, etc., and sets the coordinate system. And the instances of Axes supports callbacks through a callbacks attribute.
matplotlib.axes.Axes.update() Function
The Axes.update() function in axes module of matplotlib library is used to update this artist’s properties from the dictionary props.
Syntax: Axes.update(self, props)
Parameters: This method accepts the following parameters.
- props: This parameter is the dictionary of the properties.
Returns: This method does not return any value.
Below examples illustrate the matplotlib.axes.Axes.update() function in matplotlib.axes:
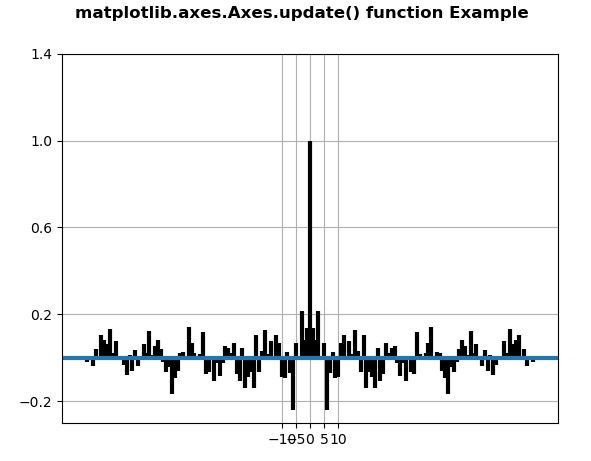
Example 1:
import matplotlib.pyplot as plt
import numpy as np
np.random.seed(10**7)
geeks = np.random.randn(100)
fig, ax = plt.subplots()
ax.acorr(geeks, usevlines = True,
normed = True,
maxlags = 80, lw = 3)
ax.grid(True)
prop = {'xticks': np.array([-10., -5., 0., 5., 10. ]),
'yticks': np.array([-0.2, 0.2, 0.6, 1., 1.4]),
'ylabel': None, 'xlabel': None}
ax.update(prop)
fig.suptitle('matplotlib.axes.Axes.update()\
function Example', fontweight ="bold")
plt.show()
|
Output:
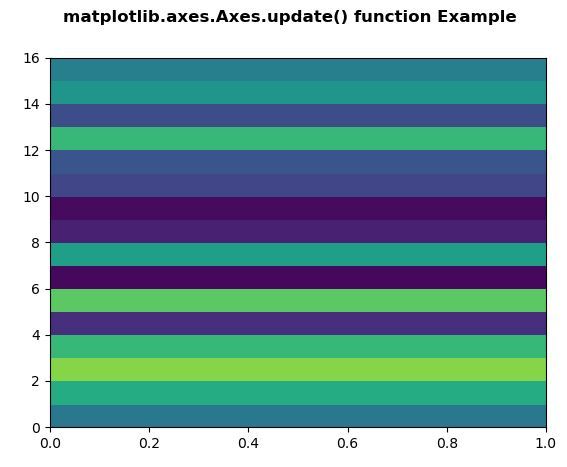
Example 2:
import numpy as np
import matplotlib.pyplot as plt
xx = np.random.rand(16, 30)
fig, ax = plt.subplots()
m = ax.pcolor(xx)
m.set_zorder(-20)
prop = {'autoscalex_on': False}
w = ax.update(prop)
fig.suptitle('matplotlib.axes.Axes.update()\
function Example', fontweight ="bold")
plt.show()
|
Output:
Like Article
Suggest improvement
Share your thoughts in the comments
Please Login to comment...