Matplotlib.axes.Axes.twinx() in Python
Last Updated :
10 Jan, 2024
A numerical–mathematical Matplotlib is a library in Python and it is a numerical–-mathematical extension for the NumPy library. The Axes Class contains most of the figure elements: Axis, Tick, Line2D, Text, Polygon, etc., and sets the coordinate system. The instances of Axes support callbacks through a callbacks attribute.
Matplotlib.axes.Axes.twinx() Function Syntax in Python
The Axes.twinx() function in the axes module of the matplotlib library is used to create twin Axes sharing the x-axis.
Syntax: Axes.twinx(self)
Parameters: This method does not accepts any parameters.
Return value: This method is used to returns the following.
- ax_twin : This returns the newly created Axes instance.
What is Matplotlib.axes.Axes.twinx() in Python?
Matplotlib.axes.Axes.twinx() is a method in Matplotlib, a popular Python plotting library. This method is used to create twin Axes sharing the x-axis but with a different y-axis. It allows you to overlay two plots with different y-scales on the same set of x-axis values. This is particularly useful when you want to visualize data with different units or scales in the same plot.
Matplotlib Twin Axes Usage Examples
There are various ways of Matplotlib twin axes usage. Here we are explaining some general ways of Matplotlib twin axes usage those are following.
Create Matplotlib Twin Axes
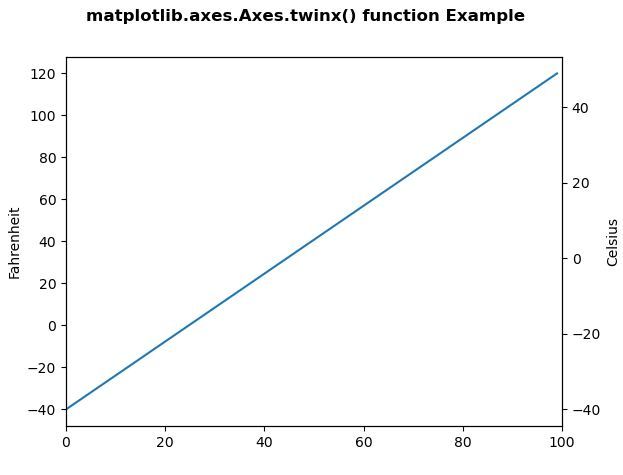
In this example code utilizes Matplotlib to create a dual y-axis plot showing Fahrenheit and Celsius temperatures. The `GFG1` function converts Fahrenheit to Celsius, and `GFG2` synchronizes the y-axis scales. The plot demonstrates the use of `matplotlib.axes.Axes.twinx()` for twinning y-axes in a temperature graph.
Python3
import matplotlib.pyplot as plt
import numpy as np
def GFG1(temp):
return (5. / 9.) * (temp - 32)
def GFG2(ax1):
y1, y2 = ax1.get_ylim()
ax_twin .set_ylim(GFG1(y1), GFG1(y2))
ax_twin .figure.canvas.draw()
fig, ax1 = plt.subplots()
ax_twin = ax1.twinx()
ax1.callbacks.connect("ylim_changed", GFG2)
ax1.plot(np.linspace(-40, 120, 100))
ax1.set_xlim(0, 100)
ax1.set_ylabel('Fahrenheit')
ax_twin .set_ylabel('Celsius')
fig.suptitle('matplotlib.axes.Axes.twinx()\
function Example\n\n', fontweight ="bold")
plt.show()
|
Output:
Multiple Axes in Matplotlib with a numerical–data
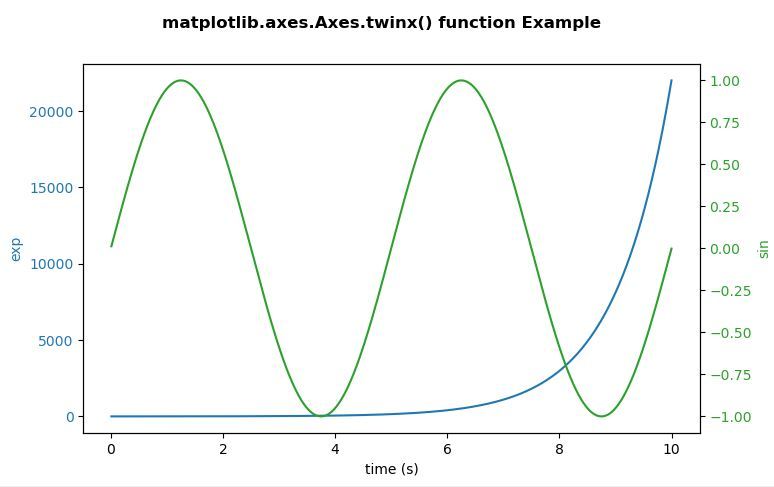
In this example code uses Matplotlib to create a dual-axis plot with two sets of mock data: an exponential growth (‘exp’) and a sine wave (‘sin’). The primary y-axis (`ax1`) displays ‘exp,’ while the secondary y-axis (`ax2`) shares the same x-axis and displays ‘sin’ using `twinx()`. The resulting plot visualizes the behavior of both datasets over time with labeled axes and a title.
Python3
import numpy as np
import matplotlib.pyplot as plt
t = np.arange(0.01, 10.0, 0.001)
data1 = np.exp(t)
data2 = np.sin(0.4 * np.pi * t)
fig, ax1 = plt.subplots()
color = 'tab:blue'
ax1.set_xlabel('time (s)')
ax1.set_ylabel('exp', color = color)
ax1.plot(t, data1, color = color)
ax1.tick_params(axis ='y', labelcolor = color)
ax2 = ax1.twinx()
color = 'tab:green'
ax2.set_ylabel('sin', color = color)
ax2.plot(t, data2, color = color)
ax2.tick_params(axis ='y', labelcolor = color)
fig.suptitle('matplotlib.axes.Axes.twinx() \
function Example\n\n', fontweight ="bold")
plt.show()
|
Output:
Share your thoughts in the comments
Please Login to comment...