Matplotlib.axes.Axes.set_zorder() in Python
Last Updated :
30 Apr, 2020
Matplotlib is a library in Python and it is numerical – mathematical extension for NumPy library. The Axes Class contains most of the figure elements: Axis, Tick, Line2D, Text, Polygon, etc., and sets the coordinate system. And the instances of Axes supports callbacks through a callbacks attribute.
matplotlib.axes.Axes.set_zorder() Function
The Axes.set_zorder() function in axes module of matplotlib library is used to set the zorder for the artist.
Syntax: Axes.set_zorder(self, level)
Parameters: This method accepts only one parameters.
- level: This parameter contains the float value.
Returns: This method does not return any value.
Below examples illustrate the matplotlib.axes.Axes.set_zorder() function in matplotlib.axes:
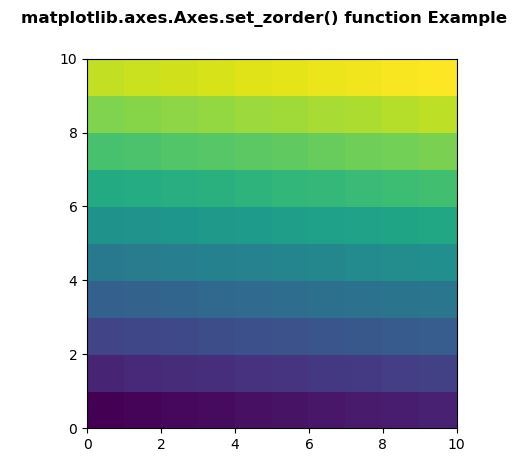
Example 1:
import numpy as np
import matplotlib.pyplot as plt
d = np.arange(100).reshape(10, 10)
xx, yy = np.meshgrid(np.arange(11), np.arange(11))
fig, ax = plt.subplots()
ax.set_aspect(1)
m = ax.pcolormesh(xx, yy, d)
m.set_zorder(-15)
fig.suptitle('matplotlib.axes.Axes.set_zorder() function\
Example', fontweight ="bold")
plt.show()
|
Output:
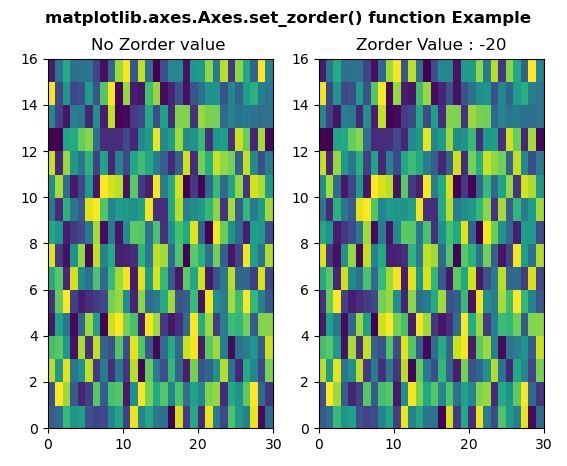
Example-2:
import numpy as np
import matplotlib.pyplot as plt
xx = np.random.rand(16, 30)
fig, (ax3, ax4) = plt.subplots(1, 2)
m = ax3.pcolor(xx)
ax3.set_title("No Zorder value ")
m = ax4.pcolor(xx)
m.set_zorder(-20)
ax4.set_title("Zorder Value : -20")
fig.suptitle('matplotlib.axes.Axes.set_zorder() \
function Example', fontweight ="bold")
plt.show()
|
Output:
Like Article
Suggest improvement
Share your thoughts in the comments
Please Login to comment...