Matplotlib.axes.Axes.set_ylabel() in Python
Last Updated :
19 Apr, 2020
Matplotlib is a library in Python and it is numerical – mathematical extension for NumPy library. The Axes Class contains most of the figure elements: Axis, Tick, Line2D, Text, Polygon, etc., and sets the coordinate system. And the instances of Axes supports callbacks through a callbacks attribute.
matplotlib.axes.Axes.set_ylabel() Function
The Axes.set_ylabel() function in axes module of matplotlib library is used to set the label for the y-axis.
Syntax: Axes.set_ylabel(self, xlabel, fontdict=None, labelpad=None, **kwargs)
Parameters: This method accepts the following parameters.
- ylabel : This parameter is the label text.
- labelpad : This parameter is the spacing in points from the axes bounding box including ticks and tick labels.
Returns:This method does not returns any value.
Below examples illustrate the matplotlib.axes.Axes.set_ylabel() function in matplotlib.axes:
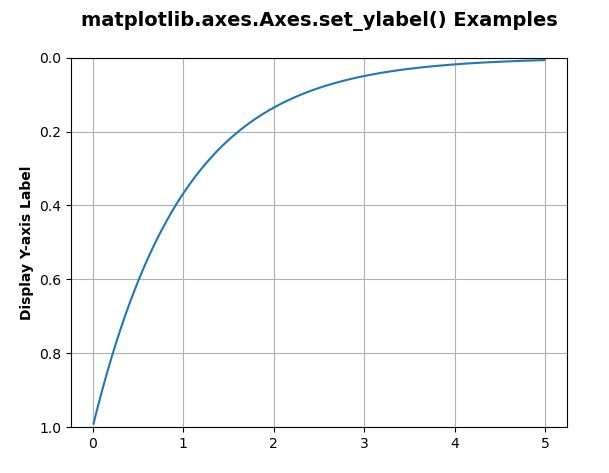
Example 1:
import matplotlib.pyplot as plt
import numpy as np
t = np.arange(0.01, 5.0, 0.01)
s = np.exp(-t)
fig, ax = plt.subplots()
ax.plot(t, s)
ax.set_ylim(1, 0)
ax.set_ylabel('Display Y-axis Label',
fontweight ='bold')
ax.grid(True)
ax.set_title('matplotlib.axes.Axes.set_ylabel() \
Examples\n', fontsize = 14, fontweight ='bold')
plt.show()
|
Output:
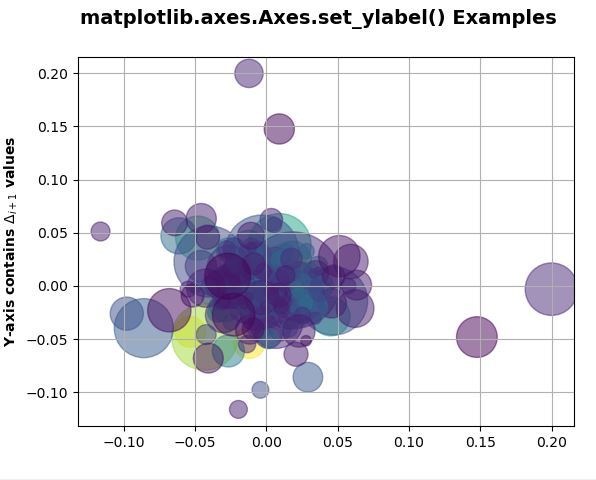
Example 2:
import numpy as np
import matplotlib.pyplot as plt
import matplotlib.cbook as cbook
with cbook.get_sample_data('goog.npz') as datafile:
price_data = np.load(datafile)['price_data'].view(np.recarray)
price_data = price_data[-250:]
delta1 = np.diff(price_data.adj_close) / price_data.adj_close[:-1]
volume = (25 * price_data.volume[:-2] / price_data.volume[0])**(2.2)
close = (0.03 * price_data.close[:-2] / 0.03 * price_data.open[:-2])**2
fig, ax = plt.subplots()
ax.scatter(delta1[:-1], delta1[1:],
c=close, s=volume,
alpha=0.5)
ax.set_ylabel(r'Y-axis contains $\Delta_{i+1}$ values',
fontweight='bold')
ax.grid(True)
fig.suptitle('matplotlib.axes.Axes.set_ylabel() Examples\n',
fontsize=14, fontweight='bold')
plt.show()
|
Output:
Like Article
Suggest improvement
Share your thoughts in the comments
Please Login to comment...