Matplotlib.axes.Axes.set_clip_box() in Python
Last Updated :
30 Apr, 2020
Matplotlib is a library in Python and it is numerical – mathematical extension for NumPy library. The Axes Class contains most of the figure elements: Axis, Tick, Line2D, Text, Polygon, etc., and sets the coordinate system. And the instances of Axes supports callbacks through a callbacks attribute.
matplotlib.axes.Axes.set_clip_box() Function
The Axes.set_clip_box() function in axes module of matplotlib library is used to set the artist’s clip Bbox.
Syntax: Axes.set_clip_box(self, clipbox)
Parameters: This method accepts only one parameters.
- clipbox: This parameter is the Bbox.
Returns: This method does not return any value.
Below examples illustrate the matplotlib.axes.Axes.set_clip_box() function in matplotlib.axes:
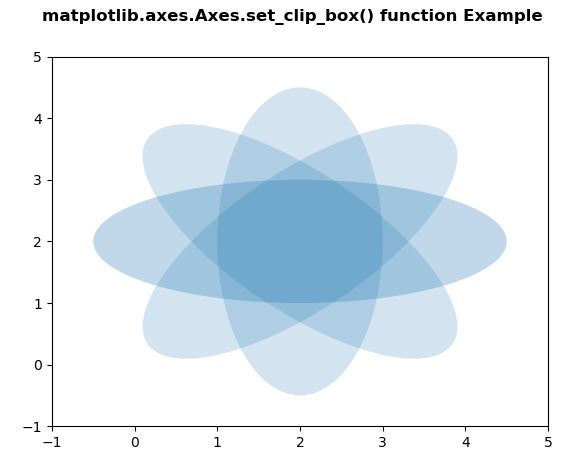
Example 1:
import matplotlib.pyplot as plt
import numpy as np
from matplotlib.patches import Ellipse
delta = 45.0
angles = np.arange(0, 360 + delta, delta)
ells = [Ellipse((2, 2), 5, 2, a) for a in angles]
fig, ax = plt.subplots()
for e in ells:
e.set_clip_box(ax.bbox)
e.set_alpha(0.1)
ax.add_artist(e)
plt.xlim(-1, 5)
plt.ylim(-1, 5)
fig.suptitle('matplotlib.axes.Axes.set_clip_box() \
function Example\n\n', fontweight ="bold")
plt.show()
|
Output:
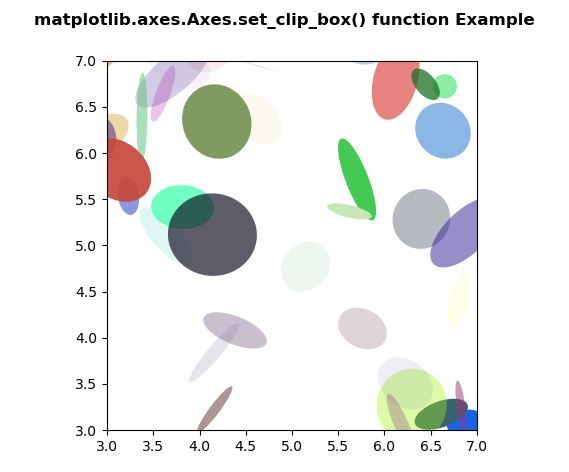
Example-2:
import matplotlib.pyplot as plt
import numpy as np
from matplotlib.patches import Ellipse
NUM = 200
ells = [Ellipse(xy = np.random.rand(2) * 10,
width = np.random.rand(),
height = np.random.rand(),
angle = np.random.rand() * 360)
for i in range(NUM)]
fig, ax = plt.subplots(subplot_kw ={'aspect': 'equal'})
for e in ells:
ax.add_artist(e)
e.set_clip_box(ax.bbox)
e.set_alpha(np.random.rand())
e.set_facecolor(np.random.rand(4))
ax.set_xlim(3, 7)
ax.set_ylim(3, 7)
fig.suptitle('matplotlib.axes.Axes.set_clip_box() \
function Example\n\n', fontweight ="bold")
plt.show()
|
Output:
Like Article
Suggest improvement
Share your thoughts in the comments
Please Login to comment...