Matplotlib.axes.Axes.hlines() in Python
Last Updated :
13 Apr, 2020
Matplotlib is a library in Python and it is numerical – mathematical extension for NumPy library. The Axes Class contains most of the figure elements: Axis, Tick, Line2D, Text, Polygon, etc., and sets the coordinate system. And the instances of Axes supports callbacks through a callbacks attribute.
matplotlib.axes.Axes.hlines() Function
The Axes.hlines() function in axes module of matplotlib library is used to Plot vertical lines at each y from xmin to xmax.
Syntax: Axes.hlines(self, y, xmin, xmax, colors=’k’, linestyles=’solid’, label=”, *, data=None, **kwargs)
Parameters: This method accept the following parameters that are described below:
- y: This parameter is the sequence of y-indexes where to plot the lines.
- xmin, xmax: These parameter contains an array.And they represents the beginning and end of each line.
- colors: This parameter is an optional parameter. And it is the color of the lines with default value k.
- linetsyle: This parameter is also an optional parameter. And it is used to represent the linestyle{‘solid’, ‘dashed’, ‘dashdot’, ‘dotted’}.
- label: This parameter is also an optional parameter.It is the label of the plot.
Returns: This returns the LineCollection.
Below examples illustrate the matplotlib.axes.Axes.hlines() function in matplotlib.axes:
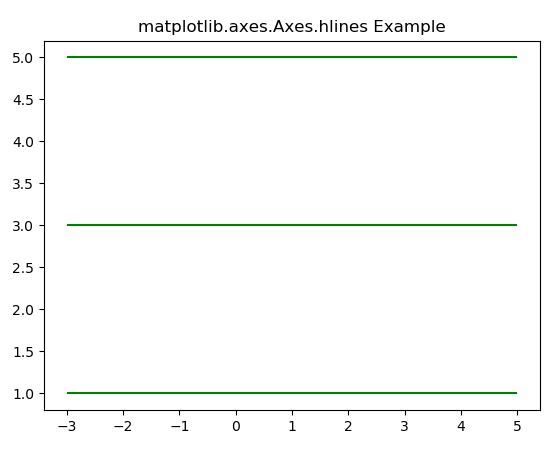
Example #1:
import numpy as np
from matplotlib import patches
import matplotlib.pyplot as plt
fig, ax = plt.subplots()
ax.hlines([1, 3, 5], -3, 5, color ="green")
ax.set_title('matplotlib.axes.Axes.hlines Example')
plt.show()
|
Output:
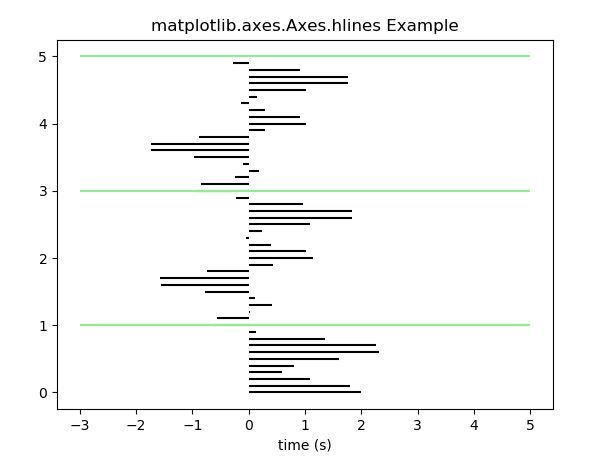
Example #2:
import numpy as np
from matplotlib import patches
import matplotlib.pyplot as plt
t = np.arange(0.0, 5.0, 0.1)
s = np.exp(-t) + np.cos(3 * np.pi * t) + np.sin(np.pi * t)
nse = np.random.normal(0.0, 0.8, t.shape) * s
fig, ax = plt.subplots()
ax.hlines(t, [0], s)
ax.set_xlabel('time (s)')
ax.hlines([1, 3, 5], -3, 5, color ="lightgreen")
ax.set_title('matplotlib.axes.Axes.hlines Example')
plt.show()
|
Output:
Like Article
Suggest improvement
Share your thoughts in the comments
Please Login to comment...