Matplotlib.axes.Axes.hexbin() in Python
Last Updated :
13 Apr, 2020
Matplotlib is a library in Python and it is numerical – mathematical extension for NumPy library. The Axes Class contains most of the figure elements: Axis, Tick, Line2D, Text, Polygon, etc., and sets the coordinate system. And the instances of Axes supports callbacks through a callbacks attribute.
matplotlib.axes.Axes.hexbin() Function
The Axes.hexbin() function in axes module of matplotlib library is used to make a 2D hexagonal binning plot of points x, y,
Syntax: Axes.hexbin(self, x, y, C=None, gridsize=100, bins=None, xscale=’linear’, yscale=’linear’, extent=None, cmap=None, norm=None, vmin=None, vmax=None, alpha=None, linewidths=None, edgecolors=’face’, reduce_C_function=, mincnt=None, marginals=False, *, data=None, **kwargs)
Parameters: This method accept the following parameters that are described below:
- x, y: These parameter are the sequence of data. x and y must be of the same length.
- C : This parameter are the values which are accumulated in the bins.
- gridsize : This parameter represents the number of hexagons in the x-direction or both direction.
- xscale : This parameter uses a linear or log10 scale on the horizontal axis.
- xycale : This parameter uses a linear or log10 scale on the vertical axis.
- mincnt : This parameter is used to display cells with more than mincnt number of points in the cell.
- marginals : This parameter is used to plot the marginal density as colormapped rectangles along the bottom of the x-axis and left of the y-axis.
- extent : This parameter is the limits of the bins.
Returns: This returns the following:
- polycollection :This returns the PolyCollection defining the hexagonal bins.
Below examples illustrate the matplotlib.axes.Axes.hexbin() function in matplotlib.axes:
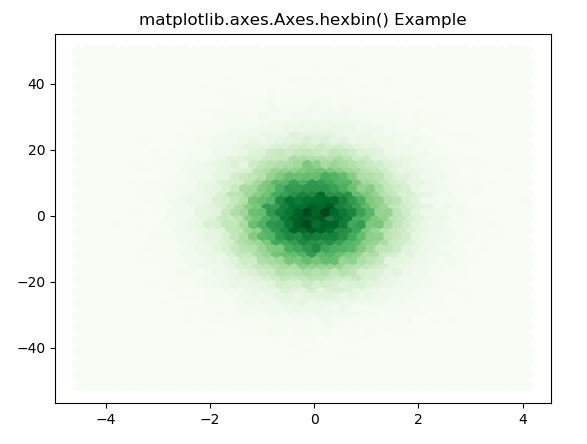
Example-1:
import matplotlib.pyplot as plt
import numpy as np
np.random.seed(19680801)
n = 100000
x = np.random.standard_normal(n)
y = 12 * np.random.standard_normal(n)
fig, ax = plt.subplots()
ax.hexbin(x, y, gridsize = 50, cmap ='Greens')
ax.set_title('matplotlib.axes.Axes.hexbin() Example')
plt.show()
|
Output:
Example-2:
import matplotlib.pyplot as plt
import numpy as np
np.random.seed(19680801)
n = 100000
x = np.random.standard_normal(n)
y = 2 * np.random.standard_normal(n)
z =[1, 2, 3, 4]
xmin = x.min()
xmax = x.max()
ymin = y.min()
ymax = y.max()
fig, axs = plt.subplots(ncols = 3,
sharey = True)
ax = axs[0]
hb = ax.hexbin(x, y, gridsize = 50,
bins ='log',
cmap ='BuGn')
ax.set(xlim =(xmin, xmax),
ylim =(ymin, ymax))
cb = fig.colorbar(hb, ax = ax)
cb.set_label('log')
ax = axs[1]
hb = ax.hexbin(x, y, gridsize = 50,
cmap ='Greens')
ax.set(xlim =(xmin, xmax),
ylim =(ymin, ymax))
cb = fig.colorbar(hb, ax = ax)
cb.set_label('Values')
ax.set_title('matplotlib.axes.Axes.\
hexbin() Example')
ax = axs[2]
hb = ax.hexbin(x, y, gridsize = 50,
bins = z, cmap ='BuGn')
ax.set(xlim =(xmin, xmax),
ylim =(ymin, ymax))
cb = fig.colorbar(hb, ax = ax)
cb.set_label(z)
plt.show()
|
Output:

Like Article
Suggest improvement
Share your thoughts in the comments
Please Login to comment...