Matplotlib.axes.Axes.get_transformed_clip_path_and_affine() in Python
Last Updated :
30 Apr, 2020
Matplotlib is a library in Python and it is numerical – mathematical extension for NumPy library. The Axes Class contains most of the figure elements: Axis, Tick, Line2D, Text, Polygon, etc., and sets the coordinate system. And the instances of Axes supports callbacks through a callbacks attribute.
matplotlib.axes.Axes.get_transformed_clip_path_and_affine() Function
The Axes.get_transformed_clip_path_and_affine() function in axes module of matplotlib library is used to get the clip path with the non-affine part of its transformation applied, and the remaining affine part of its transformation.
Syntax: Axes.get_transformed_clip_path_and_affine(self)
Parameters: This method does not accepts any parameter.
Returns: This method return the clip path with the non-affine part of its transformation applied, and the remaining affine part of its transformation.
Below examples illustrate the matplotlib.axes.Axes.get_transformed_clip_path_and_affine() function in matplotlib.axes:
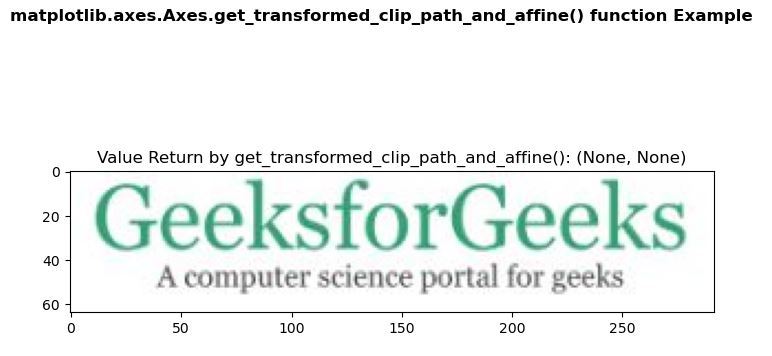
Example 1:
Image used:

import matplotlib.pyplot as plt
import matplotlib.patches as patches
import matplotlib.cbook as cbook
with cbook.get_sample_data('loggf.PNG') as image_file:
image = plt.imread(image_file)
fig, ax = plt.subplots()
im = ax.imshow(image)
patch = patches.Rectangle((0, 0), 260, 200,
transform = ax.transData)
ax.set_title("Value Return by get_transformed_clip_path_and_affine(): "
+str(im.get_transformed_clip_path_and_affine()))
fig.suptitle('matplotlib.axes.Axes.get_transformed_clip_path_and_affine()\
function Example\n\n', fontweight ="bold")
plt.show()
|
Output:
Example 2:
import numpy as np
import matplotlib.cm as cm
import matplotlib.pyplot as plt
from matplotlib.path import Path
from matplotlib.patches import PathPatch
delta = 0.025
x = y = np.arange(-3.0, 3.0, delta)
X, Y = np.meshgrid(x, y)
Z1 = np.exp(-X**2 - Y**2)
Z2 = np.exp(-(X - 1)**2 - (Y - 1)**2)
Z = (Z1 - Z2) * 2
path = Path([[0, 1], [1, 0], [0, -1], [-1, 0], [0, 1]])
patch = PathPatch(path, facecolor ='none')
fig, ax = plt.subplots()
ax.add_patch(patch)
im = ax.imshow(Z,
interpolation ='bilinear',
cmap = cm.gray,
origin ='lower',
extent =[-3, 3, -3, 3],
clip_path = patch,
clip_on = True)
print("Value Return by get_transformed_clip_path_and_affine(): ")
for i in im.get_transformed_clip_path_and_affine():
print(i)
fig.suptitle('matplotlib.axes.Axes.get_transformed_clip_path_and_affine()\
function Example\n\n', fontweight ="bold")
plt.show()
|
Output:
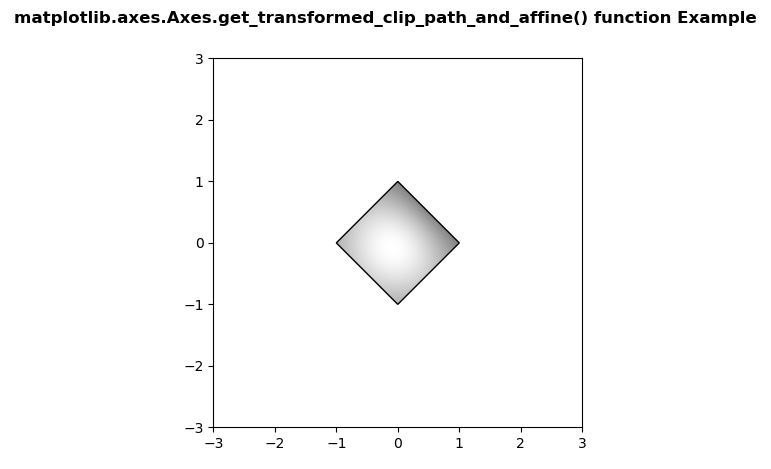
Value Return by get_transformed_clip_path_and_affine():
Path(array([[ 0.,  1.],
       [ 1.,  0.],
       [ 0., -1.],
       [-1.,  0.],
       [ 0.,  1.]]), None)
Affine2D(
    [[ 82.66666667   0.         328.        ]
     [  0.          61.6        237.6       ]
     [  0.           0.           1.        ]])
Share your thoughts in the comments
Please Login to comment...