Matplotlib.axes.Axes.get_lines() in Python
Last Updated :
27 Apr, 2020
Matplotlib is a library in Python and it is numerical – mathematical extension for NumPy library. The Axes Class contains most of the figure elements: Axis, Tick, Line2D, Text, Polygon, etc., and sets the coordinate system. And the instances of Axes supports callbacks through a callbacks attribute.
matplotlib.axes.Axes.get_lines() Function
The Axes.get_lines() function in axes module of matplotlib library is used to return a list of lines contained by the Axes
Syntax: Axes.get_lines(self)
Parameters: This method does not accept any parameters.
Returns: This method return a list of lines contained by the Axes.
Below examples illustrate the matplotlib.axes.Axes.get_lines() function in matplotlib.axes:
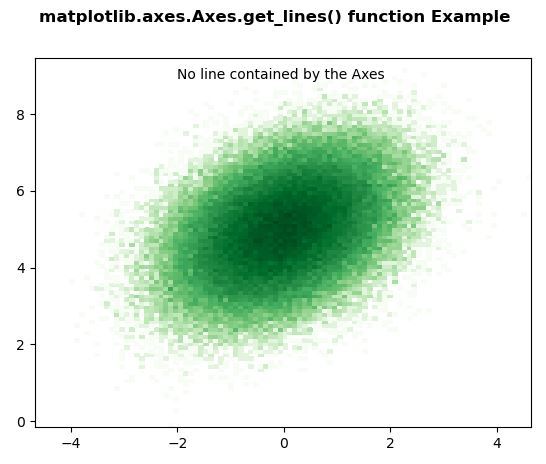
Example 1:
from matplotlib import colors
from matplotlib.ticker import PercentFormatter
import numpy as np
import matplotlib.pyplot as plt
N_points = 100000
x = np.random.randn(N_points)
y = .4 * x + np.random.randn(100000) + 5
fig, ax = plt.subplots()
ax.hist2d(x, y, bins = 100,
norm = colors.LogNorm(),
cmap ="Greens")
w = list(ax.get_lines())
if len(w)== 0:
ax.text(-2, 8.5,
"No line contained by the Axes \n")
else:
ax.text(-3, 8.5,
"List of the lines contained by the Axes \n")
x = 8.5
for i in w:
ax.text(-3, x-0.5, str(i))
x-= 0.5
fig.suptitle('matplotlib.axes.Axes.get_lines() \
function Example', fontweight ="bold")
plt.show()
|
Output:
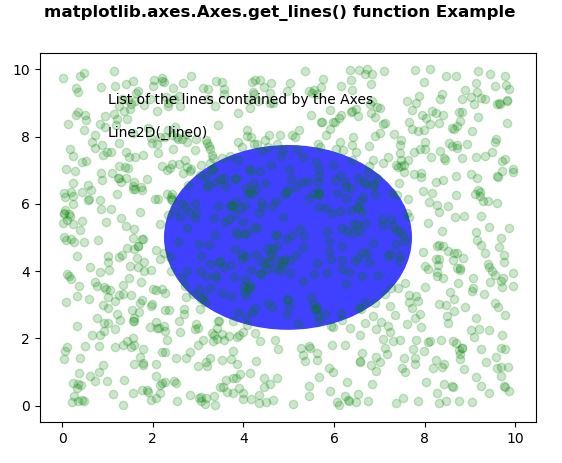
Example 2:
import numpy as np
import matplotlib.pyplot as plt
import matplotlib.patches as mpatches
fig, ax = plt.subplots()
x, y = 10 * np.random.rand(2, 1000)
ax.plot(x, y, 'go', alpha = 0.2)
circ = mpatches.Circle((0.5, 0.5),
0.25,
transform = ax.transAxes,
facecolor ='blue',
alpha = 0.75)
ax.add_patch(circ)
w = list(ax.get_lines())
if len(w)== 0:
ax.text(1, 8.5,
"No line contained by the Axes \n")
else:
ax.text(1, 8.5,
"List of the lines contained by the Axes \n")
x = 8.5
for i in w:
ax.text(1, x-0.5, str(i))
x-= 0.5
fig.suptitle('matplotlib.axes.Axes.get_lines() \
function Example', fontweight ="bold")
plt.show()
|
Output:
Like Article
Suggest improvement
Share your thoughts in the comments
Please Login to comment...