MATLAB | Display histogram of a grayscale Image
Last Updated :
26 Jan, 2019
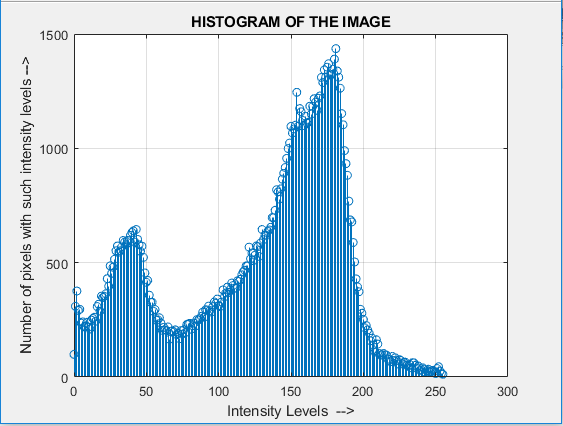
An image histogram is chart representation of the distribution of intensities in an Indexed image or grayscale image. It shows how many times each intensity value in image occurs.
Code #1: Display histogram of an image using MATLAB library function.
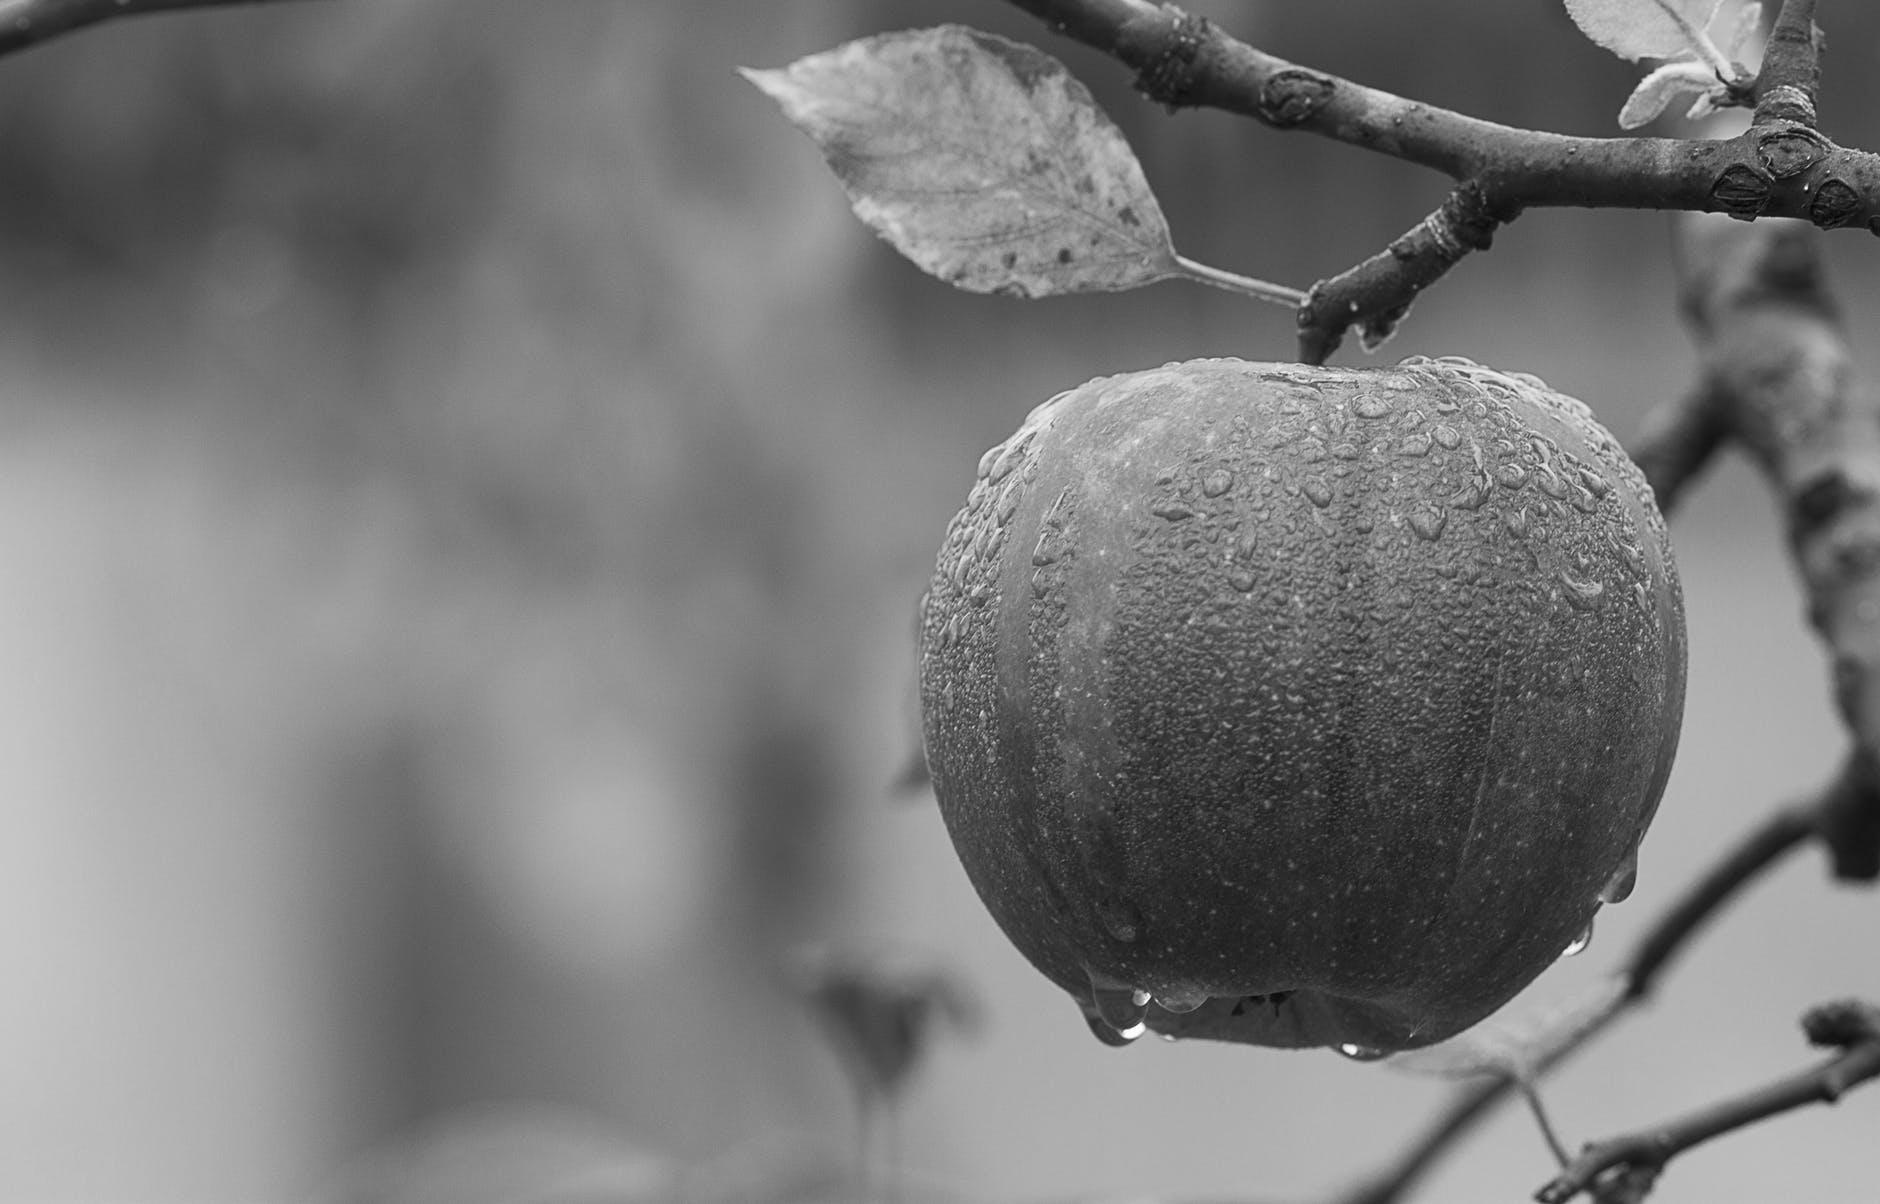
img=imread('apple.jpg');
# if read image is an RGB image
img=rgb2gray(img);
# using imhist() function
imhist(img);
|
Code #2: Display Histogram of an Image without using MATLAB Library function.
Approach :
- Read the source image file into image matrix
- Convert it to grayscale, if it is an RGB image
- Iterate over image matrix and count the frequency of every possible value of intensity
- plot the counted frequency
img = imread('apple.jpg');
img=rgb2gray(img);
[x, y] = size(img);
frequency = 1 : 256;
count = 0;
for i = 1 : 256
for j = 1 : x
for k = 1 : y
if img(j, k) == i-1
count = count + 1;
end
end
end
frequency(i) = count;
count = 0;
end
n = 0 : 255;
stem(n, frequency);
grid on;
ylabel('Number of pixels with such intensity levels -->');
xlabel('Intensity Levels -->');
title('HISTOGRAM OF THE IMAGE');
|
Input:
Output:
Like Article
Suggest improvement
Share your thoughts in the comments
Please Login to comment...