Mann and Whitney U test
Last Updated :
26 Nov, 2020
Mann and Whitney’s U-test or Wilcoxon rank-sum test is the non-parametric statistic hypothesis test that is used to analyze the difference between two independent samples of ordinal data. In this test, we have provided two randomly drawn samples and we have to verify whether these two samples is from the same population.
The assumption for Mann-Whitney U test:
- All observations of both groups are independent of each other.
- The values of the dependent variable should be in an ordinal manner (means they can be compared to each other and ranked in order of highest to lowest).
- The independent variable should be two independent, categorical groups.
- For each of the sample recommended number is between 5 and 20.
- The null hypothesis in Mann-Whitney U-test is always the same i.e. there is no significant difference between the two samples.
- Mann Whitney test is applied to two distribution that need not be normally distributed but should have the same curve shape. For Example: If one curve (of a sample) has longer right-tailed, the other curve (or other samples) should also have a longer right tail.
The advantage of using the Mann-Whitney U test is that it has no effect because of the outliers as it considers the median instead of the mean for the test.
Steps for Performing the Mann Whitney U test:
- Collect two samples and sample 1 and sample 2.
- Take the first observation from sample 1 and compare it with observations in sample 2. Count the number of observations in Sample 2 that are smaller than that and equal to it. For, example, 10 observations in sample 2 are smaller than the first observation in sample 1 and 2 equal then out U statistics for this sample: 10 + 2(1/2) = 11
- Repeat Step 2 for all observations in sample 1
- Add up all of your totals from Steps 2 and 3. This isour rank sum.
- Now, we calculatethe U statistics using following formula


- where:
- n1: number of samples in sample 1
- n2: number of samples in sample 2
- R1: Rank sum of sample 1
- R2: Rank sum of sample 2
- Now, our test statistic (U) will be smaller of U1 and U2.
- Now, we look to the critical values in the table with respect to n1 and n2 (take it U0).
- if U <= U0 : we reject the null hypothesis.
- else, we do not reject the null hypothesis.
Examples:
- Suppose there is a test performed on the two batches of students and the results are below:
| Batch 1 | Batch 2 |
|---|
| 3 | 9 |
| 4 | 7 |
| 2 | 5 |
| 6 | 10 |
| 2 | 8 |
| 5 | 6 |
- Here, our null hypothesis will be
- H0: There is no significant difference between batches.
- HA: There is a significant difference between batches.
- Here, our level of significance is 0.05
- Now, we rank the samples according to batches, if two samples have same rank then we will average the rank
| Batch 1 | Rank (Batch 1) | Batch 2 | Rank (Batch 2) |
|---|
| 2 | 1.5 | 5 | 5.5 |
| 2 | 1.5 | 6 | 7.5 |
| 3 | 3 | 7 | 9 |
| 4 | 4 | 8 | 10 |
| 5 | 5.5 | 9 | 11 |
| 6 | 7.5 | 10 | 12 |
| Rank Sum | 23 | Rank Sum | 55 |
- Now, we calculate the U-statistics:

[Tex]U_2 = 6*6 +6*7/2 -55 = 2[/Tex]
- So, our test statistics U = min ( U1, U2) = min (34,2) =2.
- Now, we look into the U-statistics table for n1 = 6 and n2 = 6 and level of significance for table below. Here, our critical value is:
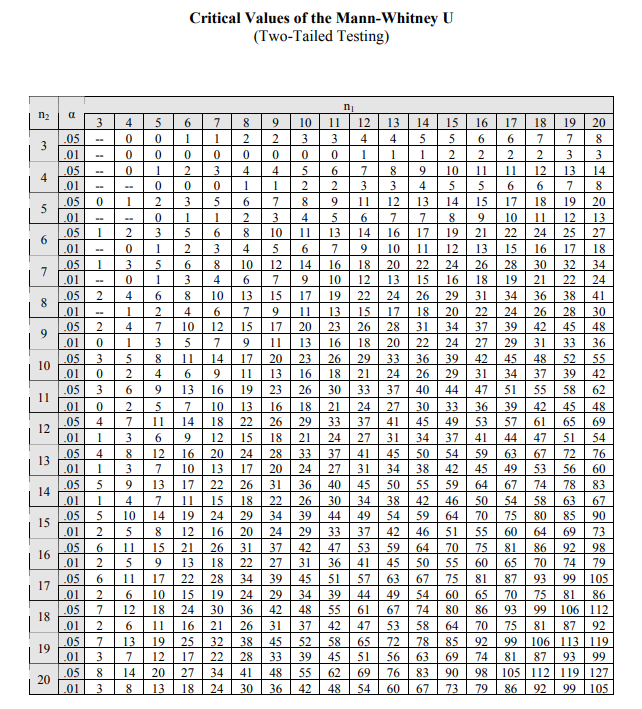
Mann-Whitney two tailed test

- Here U < U0, then we reject the null hypothesis.
Implementation:
from scipy.stats import mannwhitneyu
batch_1 =[3, 4, 2, 6, 2, 5]
batch_2 =[9, 7, 5, 10, 8, 6]
stat, p_value = mannwhitneyu(batch_1, batch_2)
print('Statistics=%.2f, p=%.2f' % (stat, p_value))
alpha = 0.05
if p_value < alpha:
print('Reject Null Hypothesis (Significant difference between two samples)')
else:
print('Do not Reject Null Hypothesis (No significant difference between two samples)')
|
Output:
Statistics=2.00, p=0.01
Reject Null Hypothesis (Significant difference between two samples)
Like Article
Suggest improvement
Share your thoughts in the comments
Please Login to comment...