Mandelbrot Fractal Set visualization in Python
Last Updated :
04 Sep, 2023
Fractal:
A fractal is a curve or geometrical figure, each part of which has the same statistical character as the whole. They are useful in modeling structures (such as snowflakes) in which similar patterns recur at progressively smaller scales, and in describing partly random or chaotic phenomena such as crystal growth and galaxy formation. In simpler words, a fractal is a never-ending pattern. Fractals are infinitely complex patterns that are self-similar across different scales. They are created by repeating a simple process over and over in an ongoing feedback loop. Driven by recursion, fractals are images of dynamic systems – the pictures of Chaos. Geometrically, they exist in between our familiar dimensions. Fractal patterns are extremely familiar since nature is full of fractals. For instance: trees, rivers, coastlines, mountains, clouds, seashells, hurricanes, etc. Abstract fractals – such as the Mandelbrot Set – can be generated by a computer calculating a simple equation over and over.
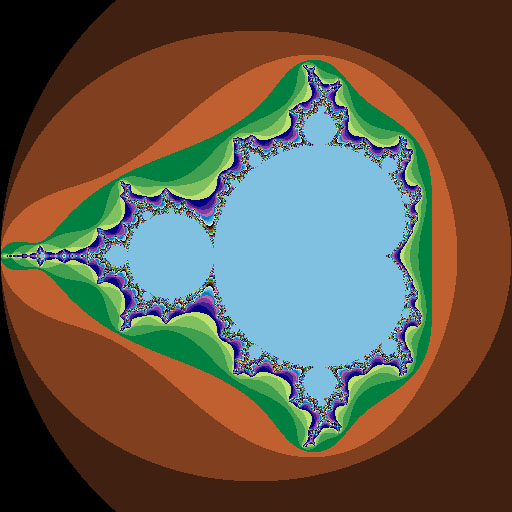
Mandelbrot set:
The Mandelbrot set is the set of complex numbers
c for which the function  does not diverge when iterated from z=0, i.e., for which the sequence
 , etc., remains bounded in absolute value. In simple words, Mandelbrot set is a particular set of complex numbers which has a highly convoluted fractal boundary when plotted.
Plotting – The Image.
First, we discuss the idea and then show the code in Python.
The idea

Complex Plane visualization for the idea
Say you want to create the Mandelbrot set for x in range x1 to x5 and y in range y1 to y5 then visualize the complex plane as shown in Figure 1 where each green dot represents the complex number  .
.
Then visualize all those complex numbers (the green dots) in a 2-dimensional array (maintaining their positions with respect to each other) and call it as complexArray. The complexArray has dimensions m x n (i.e. m rows and n columns). For example, for the figure above m = 5 and n = 5.
Now create a 2-dimensional array of integers of dimensions m x n and call it as iterationArray. Follow the following rules to fill the values in iterationArray – if (complexArray[i][j] belongs to the Mandelbrot-set): iterationArray[i][j] = 0, else: iterationArray[i][j] = number of iterations/recursions it took the mod to cross bound-value with complexArray[i][j]. Bit of examples to make the else condition clear – 1 if  , 2 if
  , 3 if
  and so on.
Create the heatmap of the iterationArray. (This can be accomplished in matplotlib with the help of pcolormesh and imshow methods)
Here is the algorithm to find the value to be stored in iterationArray[i][j] –
c = complexArray[i][j]
z = 0
bound-value = <some real number greater than 0>
iteration = 0
max-iterations = <some positive integer>
while(mod(z) < bound-value and iteration <= max-iterations){
    z := (z raised to power n) + c
    iteration += 1
}
if (iteration > max-iterations) :  iterationArray[i][j] = 0  [since c belongs to the multibrot set for n]
else : iterationArray[i][j] = iteration  [since c does not belong to the mandelbrot set for n]
Notes –
- To increase the resolution of the image, increase the number of elements in xdomain and ydomain.
- Ideally as per definitions, max-iterations should be infinity. But, this is practically impossible to compute, so, we set it to some finite positive integer and assume that if mod remains below the bound value for this recursion/iteration then it remains below it even for infinity. This also means that greater the value of max-iterations the greater the accuracy with which multibrot-set is obtained (accompanied by greater computation-time).
Installation of needed Python modules:
pip install pillow
pip install numpy
pip install matplotlib
Code #1:
Python3
from PIL import Image
from numpy import complex, array
import colorsys
WIDTH = 1024
def rgb_conv(i):
color = 255 * array(colorsys.hsv_to_rgb(i / 255.0, 1.0, 0.5))
return tuple(color.astype(int))
def mandelbrot(x, y):
c0 = complex(x, y)
c = 0
for i in range(1, 1000):
if abs(c) > 2:
return rgb_conv(i)
c = c * c + c0
return (0, 0, 0)
img = Image.new('RGB', (WIDTH, int(WIDTH / 2)))
pixels = img.load()
for x in range(img.size[0]):
print("%.2f %%" % (x / WIDTH * 100.0))
for y in range(img.size[1]):
pixels[x, y] = mandelbrot((x - (0.75 * WIDTH)) / (WIDTH / 4),
(y - (WIDTH / 4)) / (WIDTH / 4))
img.show()
|
Output:

Code #2:
Python3
from PIL import Image
xa = -2.0
xb = 1.0
ya = -1.5
yb = 1.5
maxIt = 255
imgx = 512
imgy = 512
image = Image.new("RGB", (imgx, imgy))
for y in range(imgy):
zy = y * (yb - ya) / (imgy - 1) + ya
for x in range(imgx):
zx = x * (xb - xa) / (imgx - 1) + xa
z = zx + zy * 1j
c = z
for i in range(maxIt):
if abs(z) > 2.0: break
z = z * z + c
image.putpixel((x, y), (i % 4 * 64, i % 8 * 32, i % 16 * 16))
image.show()
|
Output:
Code #3:
This code utilizes the matplotlib library instead of the PIL library. Matplotlib is a powerful and popularly used data visualization library for python.
Python3
import numpy as np
import matplotlib.pyplot as plt
xDomain, yDomain = np.linspace(-2,1.5,500), np.linspace(-2,2,500)
bound = 2
power = 2
max_iterations = 50
colormap = 'magma'
iterationArray = []
for y in yDomain:
row = []
for x in xDomain:
c = complex(x,y)
z = 0
for iterationNumber in range(max_iterations):
if(abs(z) >= bound):
row.append(iterationNumber)
break
else: z = z**power + c
else:
row.append(0)
iterationArray.append(row)
ax = plt.axes()
plt.rc('text', usetex = True)
ax.set_aspect('equal')
graph = ax.pcolormesh(xDomain, yDomain, iterationArray, cmap = colormap)
plt.colorbar(graph)
plt.xlabel("Real-Axis")
plt.ylabel("Imaginary-Axis")
plt.title('Multibrot set for $z_{{new}} = z^{{{}}} + c$'.format(power))
plt.gcf().set_size_inches(5,4)
plt.show()
|
Output:

Mandelbrot set created in matplotlib.
Replace the last line in the code with –
plt.savefig('./MultibrotFractal', dpi = 100)to save the figure with the name MultibrotFractal.png in the present working directory (i.e. the folder containg the python file).
If you are confused by the term Multibrot set in the code and image above then you just need to know that Mandelbrot set is the special case of Multibrot sets for power 2. That makes the code more interesting because if you alter the value of n in the code above, you can create images for other powers too! Moreover, note that by using matplotlib, we have the advantage to add more details like labels, titles and a colorbar for the colormap.
Like Article
Suggest improvement
Share your thoughts in the comments
Please Login to comment...