Mahotas – Weight of Labeled Region
Last Updated :
18 Jan, 2022
In this article we will see how we can obtain weights of labeled region in mahotas. Labeled images are integer images where the values correspond to different regions. I.e., region 1 is all of the pixels which have value 1, region two is the pixels with value 2, and so on. By convention, region 0 is the background and often handled differently. We can create a labelled region with the help of mahotas.label method.
We can get the size of each region with the help of mahotas.label_size method, this size is measured simply as the number of pixels in each region. We can instead measure the total weight in each area.
In order to do this we will use mahotas.label_size method
Syntax : mahotas.labeled_sum(array, labeled_region)
Argument : It takes two numpy.ndarray object as argument i.e random array of region shape and labeled region
Return : It returns list of numpy.float64 values
Example 1:
Python3
import mahotas as mh
import numpy as np
from pylab import imshow, show
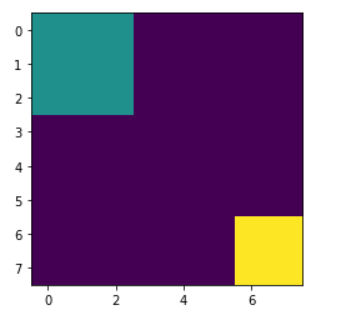
regions = np.zeros((10, 10), bool)
regions[:3, :3] = 1
regions[6:, 6:] = 1
labeled, nr_objects = mh.label(regions)
imshow(labeled, interpolation ='nearest')
show()
array = np.random.random_sample(regions.shape)
sums = mh.labeled_sum(array, labeled)
for i in range(len(sums)):
print("Sum of region " + str(i) + " : " + str(sums[i]))
|
Output :
Sum of region 0 : 38.81707025816505
Sum of region 1 : 5.627375253802732
Sum of region 2 : 8.224633573583985
Example 2:
Python3
import mahotas as mh
import numpy as np
from pylab import imshow, show
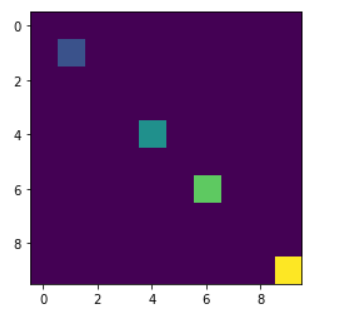
regions = np.zeros((10, 10), bool)
regions[1, 1] = 1
regions[6, 6] = 1
regions[4, 4] = 1
regions[9, 9] = 1
labeled, nr_objects = mh.label(regions)
imshow(labeled, interpolation ='nearest')
show()
array = np.random.random_sample(regions.shape)
sums = mh.labeled_sum(array, labeled)
for i in range(len(sums)):
print("Sum of region " + str(i) + " : " + str(sums[i]))
|
Output :
Sum of region 0 : 47.05475409838963
Sum of region 1 : 0.07129110100184632
Sum of region 2 : 0.9333006775043519
Sum of region 3 : 0.8322767370999588
Sum of region 4 : 0.1700224211466459
Like Article
Suggest improvement
Share your thoughts in the comments
Please Login to comment...