Mahotas – Full Histogram of Image
Last Updated :
02 Sep, 2021
In this article we will see how we can histogram of the image in mahotas. An image histogram is a type of histogram that acts as a graphical representation of the tonal distribution in a digital image. It plots the number of pixels for each tonal value. By looking at the histogram for a specific image a viewer will be able to judge the entire tonal distribution at a glance.
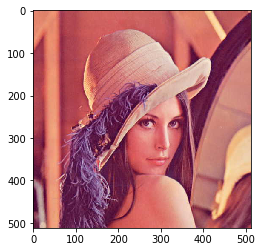
In this tutorial we will use “lena” image, below is the command to load it.
mahotas.demos.load('lena')
Below is the lena image
In order to do this we will use mahotas.fullhistogram method
Syntax : mahotas.fullhistogram(img)
Argument : It takes image object as argument
Return : It returns ndarray of type np.uint32
Note : Input image should be filtered or should be loaded as grey
In order to filter the image we will take the image object which is numpy.ndarray and filter it with the help of indexing, below is the command to do this
image = image[:, :, 0]
Below is the implementation
Python3
import mahotas
import mahotas.demos
from pylab import gray, imshow, show
import numpy as np
import matplotlib.pyplot as plt
img = mahotas.demos.load('lena')
img = img.max(2)
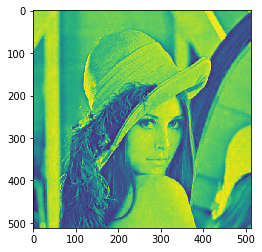
print("Image")
imshow(img)
show()
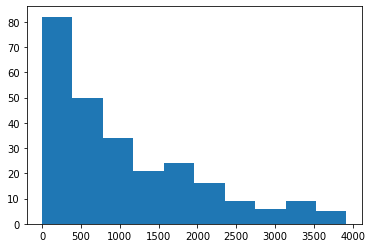
value = mahotas.fullhistogram(img)
plt.hist(value)
|
Output :
Image
(array([82., 50., 34., 21., 24., 16.,  9.,  6.,  9.,  5.]),
 array([   0.,  391.9,  783.8, 1175.7, 1567.6, 1959.5, 2351.4, 2743.3,
        3135.2, 3527.1, 3919. ]),
 a list of 10 Patch objects)
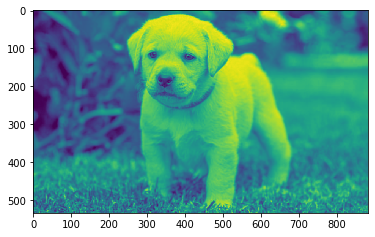
Another example
Python3
import mahotas
import numpy as np
from pylab import gray, imshow, show
import os
import matplotlib.pyplot as plt
img = mahotas.imread('dog_image.png')
img = img[:, :, 0]
print("Image")
imshow(img)
show()
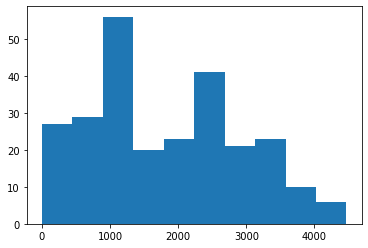
value = mahotas.fullhistogram(img)
plt.hist(value)
|
Output :
Image
(array([27., 29., 56., 20., 23., 41., 21., 23., 10.,  6.]),
 array([1.0000e+00, 4.4780e+02, 8.9460e+02, 1.3414e+03, 1.7882e+03,
        2.2350e+03, 2.6818e+03, 3.1286e+03, 3.5754e+03, 4.0222e+03,
        4.4690e+03]),
 a list of 10 Patch objects>
Like Article
Suggest improvement
Share your thoughts in the comments
Please Login to comment...