Machine learning is a subfield of artificial intelligence that involves the development of algorithms and statistical models that enable computers to improve their performance in tasks through experience. So, Machine Learning is one of the booming careers in upcoming years.
If you are preparing for your next machine learning interview, this article is a one-stop destination for you. We will be discussing the top 45+ most frequently asked machine learning interview questions for 2024. Our focus will be on real-life situations and questions that are commonly asked by companies like Google, Microsoft and Amazon during their interviews.

Machine Learning Interview Questions 2024
In this article, we’ve covered a wide range of machine learning questions for both freshers and experienced individuals, ensuring thorough preparation for your next ML interview. This ML Questions is also beneficial for individuals who are looking for a quick revision of their machine-learning concepts.
Machine Learning Interview Questions For Freshers
1. How machine learning is different from general programming?
In general programming, we have the data and the logic by using these two we create the answers. But in machine learning, we have the data and the answers and we let the machine learn the logic from them so, that the same logic can be used to answer the questions which will be faced in the future.
Also, there are times when writing logic in codes is not possible so, at those times machine learning becomes a saviour and learns the logic itself.
2. What are some real-life applications of clustering algorithms?
The clustering technique can be used in multiple domains of data science like image classification, customer segmentation, and recommendation engine. One of the most common use is in market research and customer segmentation which is then utilized to target a particular market group to expand the businesses and profitable outcomes.
3. How to choose an optimal number of clusters?
By using the Elbow method we decide an optimal number of clusters that our clustering algorithm must try to form. The main principle behind this method is that if we will increase the number of clusters the error value will decrease.
But after an optimal number of features, the decrease in the error value is insignificant so, at the point after which this starts to happen, we choose that point as the optimal number of clusters that the algorithm will try to form.
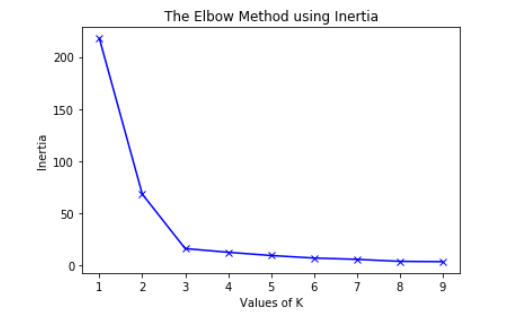
ELBOW METHOD
The optimal number of clusters from the above figure is 3.
4. What is feature engineering? How does it affect the model’s performance?
Feature engineering refers to developing some new features by using existing features. Sometimes there is a very subtle mathematical relation between some features which if explored properly then the new features can be developed using those mathematical operations.
Also, there are times when multiple pieces of information are clubbed and provided as a single data column. At those times developing new features and using them help us to gain deeper insights into the data as well as if the features derived are significant enough helps to improve the model’s performance a lot.
5. What is a Hypothesis in Machine Learning?
A hypothesis is a term that is generally used in the Supervised machine learning domain. As we have independent features and target variables and we try to find an approximate function mapping from the feature space to the target variable that approximation of mapping is known as a hypothesis.
6. How do measure the effectiveness of the clusters?
There are metrics like Inertia or Sum of Squared Errors (SSE), Silhouette Score, l1, and l2 scores. Out of all of these metrics, the Inertia or Sum of Squared Errors (SSE) and Silhouette score is a common metrics for measuring the effectiveness of the clusters.
Although this method is quite expensive in terms of computation cost. The score is high if the clusters formed are dense and well separated.
7. Why do we take smaller values of the learning rate?
Smaller values of learning rate help the training process to converge more slowly and gradually toward the global optimum instead of fluctuating around it. This is because a smaller learning rate results in smaller updates to the model weights at each iteration, which can help to ensure that the updates are more precise and stable.
If the learning rate is too large, the model weights can update too quickly, which can cause the training process to overshoot the global optimum and miss it entirely.
So, to avoid this oscillation of the error value and achieve the best weights for the model this is necessary to use smaller values of the learning rate.
8. What is Overfitting in Machine Learning and how can it be avoided?
Overfitting happens when the model learns patterns as well as the noises present in the data this leads to high performance on the training data but very low performance for data that the model has not seen earlier. To avoid overfitting there are multiple methods that we can use:
- Early stopping of the model’s training in case of validation training stops increasing but the training keeps going on.
- Using regularization methods like L1 or L2 regularization which is used to penalize the model’s weights to avoid overfitting.
9. Why we cannot use linear regression for a classification task?
The main reason why we cannot use linear regression for a classification task is that the output of linear regression is continuous and unbounded, while classification requires discrete and bounded output values.
If we use linear regression for the classification task the error function graph will not be convex. A convex graph has only one minimum which is also known as the global minima but in the case of the non-convex graph, there are chances of our model getting stuck at some local minima which may not be the global minima. To avoid this situation of getting stuck at the local minima we do not use the linear regression algorithm for a classification task.
10. Why do we perform normalization?
To achieve stable and fast training of the model we use normalization techniques to bring all the features to a certain scale or range of values. If we do not perform normalization then there are chances that the gradient will not converge to the global or local minima and end up oscillating back and forth. Read more about it here.
11. What is the difference between precision and recall?
Precision is simply the ratio between the true positives(TP) and all the positive examples (TP+FP) predicted by the model. In other words, precision measures how many of the predicted positive examples are actually true positives. It is a measure of the model’s ability to avoid false positives and make accurate positive predictions.

But in the case of a recall, we calculate the ratio of true positives (TP) and the total number of examples (TP+FN) that actually fall in the positive class. recall measures how many of the actual positive examples are correctly identified by the model. It is a measure of the model’s ability to avoid false negatives and identify all positive examples correctly.

12. What is the difference between upsampling and downsampling?
In the upsampling method, we increase the number of samples in the minority class by randomly selecting some points from the minority class and adding them to the dataset repeat this process till the dataset gets balanced for each class. But here is a disadvantage the training accuracy becomes high as in each epoch model trained more than once in each epoch but the same high accuracy is not observed in the validation accuracy.
In the case of downsampling, we decrease the number of samples in the majority class by selecting some random number of points that are equal to the number of data points in the minority class so that the distribution becomes balanced. In this case, we have to suffer from data loss which may lead to the loss of some critical information as well.
13. What is data leakage and how can we identify it?
If there is a high correlation between the target variable and the input features then this situation is referred to as data leakage. This is because when we train our model with that highly correlated feature then the model gets most of the target variable’s information in the training process only and it has to do very little to achieve high accuracy. In this situation, the model gives pretty decent performance both on the training as well as the validation data but as we use that model to make actual predictions then the model’s performance is not up to the mark. This is how we can identify data leakage.
14. Explain the classification report and the metrics it includes.
Classification reports are evaluated using classification metrics that have precision, recall, and f1-score on a per-class basis.
- Precision can be defined as the ability of a classifier not to label an instance positive that is actually negative.
- Recall is the ability of a classifier to find all positive values. For each class, it is defined as the ratio of true positives to the sum of true positives and false negatives.
- F1-score is a harmonic mean of precision and recall.
- Support is the number of samples used for each class.
- The overall accuracy score of the model is also there to get a high-level review of the performance. It is the ratio between the total number of correct predictions and the total number of datasets.
- Macro avg is nothing but the average of the metric(precision, recall, f1-score) values for each class.
- The weighted average is calculated by providing a higher preference to that class that was present in the higher number in the datasets.
15. What are some of the hyperparameters of the random forest regressor which help to avoid overfitting?
The most important hyper-parameters of a Random Forest are:
- max_depth – Sometimes the larger depth of the tree can create overfitting. To overcome it, the depth should be limited.
- n-estimator – It is the number of decision trees we want in our forest.
- min_sample_split – It is the minimum number of samples an internal node must hold in order to split into further nodes.
- max_leaf_nodes – It helps the model to control the splitting of the nodes and in turn, the depth of the model is also restricted.
16. What is the bias-variance tradeoff?
First, let’s understand what is bias and variance:
- Bias refers to the difference between the actual values and the predicted values by the model. Low bias means the model has learned the pattern in the data and high bias means the model is unable to learn the patterns present in the data i.e the underfitting.
- Variance refers to the change in accuracy of the model’s prediction on which the model has not been trained. Low variance is a good case but high variance means that the performance of the training data and the validation data vary a lot.
If the bias is too low but the variance is too high then that case is known as overfitting. So, finding a balance between these two situations is known as the bias-variance trade-off.
17. Is it always necessary to use an 80:20 ratio for the train test split?
No there is no such necessary condition that the data must be split into 80:20 ratio. The main purpose of the splitting is to have some data which the model has not seen previously so, that we can evaluate the performance of the model.
If the dataset contains let’s say 50,000 rows of data then only 1000 or maybe 2000 rows of data is enough to evaluate the model’s performance.
18. What is Principal Component Analysis?
PCA(Principal Component Analysis) is an unsupervised machine learning dimensionality reduction technique in which we trade off some information or patterns of the data at the cost of reducing its size significantly. In this algorithm, we try to preserve the variance of the original dataset up to a great extent let’s say 95%. For very high dimensional data sometimes even at the loss of 1% of the variance, we can reduce the data size significantly.
By using this algorithm we can perform image compression, visualize high-dimensional data as well as make data visualization easy.
19. What is one-shot learning?
One-shot learning is a concept in machine learning where the model is trained to recognize the patterns in datasets from a single example instead of training on large datasets. This is useful when we haven’t large datasets. It is applied to find the similarity and dissimilarities between the two images.
20. What is the difference between Manhattan Distance and Euclidean distance?
Both Manhattan Distance and Euclidean distance are two distance measurement techniques.
Manhattan Distance (MD) is calculated as the sum of absolute differences between the coordinates of two points along each dimension.

Euclidean Distance (ED) is calculated as the square root of the sum of squared differences between the coordinates of two points along each dimension.

Generally, these two metrics are used to evaluate the effectiveness of the clusters formed by a clustering algorithm.
21. What is the difference between covariance and correlation?
As the name suggests, Covariance provides us with a measure of the extent to which two variables differ from each other. But on the other hand, correlation gives us the measure of the extent to which the two variables are related to each other. Covariance can take on any value while correlation is always between -1 and 1. These measures are used during the exploratory data analysis to gain insights from the data.
22. What is the difference between one hot encoding and ordinal encoding?
One Hot encoding and ordinal encoding both are different methods to convert categorical features to numeric ones the difference is in the way they are implemented. In one hot encoding, we create a separate column for each category and add 0 or 1 as per the value corresponding to that row. Contrary to one hot encoding, In ordinal encoding, we replace the categories with numbers from 0 to n-1 based on the order or rank where n is the number of unique categories present in the dataset. The main difference between one-hot encoding and ordinal encoding is that one-hot encoding results in a binary matrix representation of the data in the form of 0 and 1, it is used when there is no order or ranking between the dataset whereas ordinal encoding represents categories as ordinal values.
23. How to identify whether the model has overfitted the training data or not?
This is the step where the splitting of the data into training and validation data proves to be a boon. If the model’s performance on the training data is very high as compared to the performance on the validation data then we can say that the model has overfitted the training data by learning the patterns as well as the noise present in the dataset.
24. How can you conclude about the model’s performance using the confusion matrix?
confusion matrix summarizes the performance of a classification model. In a confusion matrix, we get four types of output (in case of a binary classification problem) which are TP, TN, FP, and FN. As we know that there are two diagonals possible in a square, and one of these two diagonals represents the numbers for which our model’s prediction and the true labels are the same. Our target is also to maximize the values along these diagonals. From the confusion matrix, we can calculate various evaluation metrics like accuracy, precision, recall, F1 score, etc.
25. What is the use of the violin plot?
The name violin plot has been derived from the shape of the graph which matches the violin. This graph is an extension of the Kernel Density Plot along with the properties of the boxplot. All the statistical measures shown by a boxplot are also shown by the violin plot but along with this, The width of the violin represents the density of the variable in the different regions of values. This visualization tool is generally used in the exploratory data analysis step to check the distribution of the continuous data variables.
With this, we have covered some of the most important Machine Learning concepts which are generally asked by the interviewers to test the technical understanding of a candidate also, we would like to wish you all the best for your next interview.
26. What are the five statistical measures represented in a boxplot?
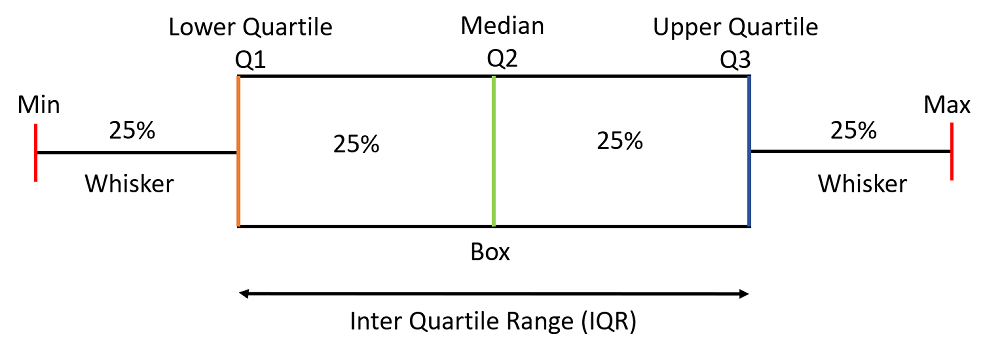
Boxplot with its statistical measures
- Left Whisker – This statistical measure is calculated by subtracting 1.5 times IQR(Inter Quartile Range) from Q1.
- IQR = Q3-Q1
- Left Whisker = Q1-1.5*IQR
- Q1 – This is also known as the 25 percentile.
- Q2 – This is the median of the data or 50 percentile.
- Q3 – This is also known as 75 percentile
- Right Whisker – This statistical measure is calculated by adding 1.5 times of IQR(Inter Quartile Range) in Q3.
- Right Whisker = Q3 + 1.5*IQR
27. What is the difference between stochastic gradient descent (SGD) and gradient descent (GD)?
In the gradient descent algorithm train our model on the whole dataset at once. But in Stochastic Gradient Descent, the model is trained by using a mini-batch of training data at once. If we are using SGD then one cannot expect the training error to go down smoothly. The training error oscillates but after some training steps, we can say that the training error has gone down. Also, the minima achieved by using GD may vary from that achieved using the SGD. It is observed that the minima achieved by using SGD are close to GD but not the same.
28. What is the Central Limit theorem?
This theorem is related to sampling statistics and its distribution. As per this theorem the sampling distribution of the sample means tends to towards a normal distribution as the sample size increases. No matter how the population distribution is shaped. i.e if we take some sample points from the distribution and calculate its mean then the distribution of those mean points will follow a normal/gaussian distribution no matter from which distribution we have taken the sample points.
There is one condition that the size of the sample must be greater than or equal to 30 for the CLT to hold. and the mean of the sample means approaches the population mean.
Advanced Machine Learning Interview Questions
29. Explain the working principle of SVM.
A data set that is not separable in different classes in one plane may be separable in another plane. This is exactly the idea behind the SVM in this a low dimensional data is mapped to high dimensional data so, that it becomes separable in the different classes. A hyperplane is determined after mapping the data into a higher dimension which can separate the data into categories. SVM model can even learn non-linear boundaries with the objective that there should be as much margin as possible between the categories in which the data has been categorized. To perform this mapping different types of kernels are used like radial basis kernel, gaussian kernel, polynomial kernel, and many others.
30. What is the difference between the k-means and k-means++ algorithms?
The only difference between the two is in the way centroids are initialized. In the k-means algorithm, the centroids are initialized randomly from the given points. There is a drawback in this method that sometimes this random initialization leads to non-optimized clusters due to maybe initialization of two clusters close to each other.
To overcome this problem k-means++ algorithm was formed. In k-means++, The first centroid is selected randomly from the data points. The selection of subsequent centroids is based on their separation from the initial centroids. The probability of a point being selected as the next centroid is proportional to the squared distance between the point and the closest centroid that has already been selected. This guarantees that the centroids are evenly spread apart and lowers the possibility of convergence to less-than-ideal clusters. This helps the algorithm reach the global minima instead of getting stuck at some local minima. Read more about it here.
31. Explain some measures of similarity which are generally used in Machine learning.
Some of the most commonly used similarity measures are as follows:
- Cosine Similarity – By considering the two vectors in n – dimension we evaluate the cosine of the angle between the two. The range of this similarity measure varies from [-1, 1] where the value 1 represents that the two vectors are highly similar and -1 represents that the two vectors are completely different from each other.
- Euclidean or Manhattan Distance – These two values represent the distances between the two points in an n-dimensional plane. The only difference between the two is in the way the two are calculated.
- Jaccard Similarity – It is also known as IoU or Intersection over union it is widely used in the field of object detection to evaluate the overlap between the predicted bounding box and the ground truth bounding box.
32. What happens to the mean, median, and mode when your data distribution is right skewed and left skewed?
In the case of a left-skewed distribution also known as a positively skewed distribution mean is greater than the median which is greater than the mode. But in the case of left-skewed distribution, the scenario is completely reversed.
Right Skewed Distribution
Mode < Median < Mean
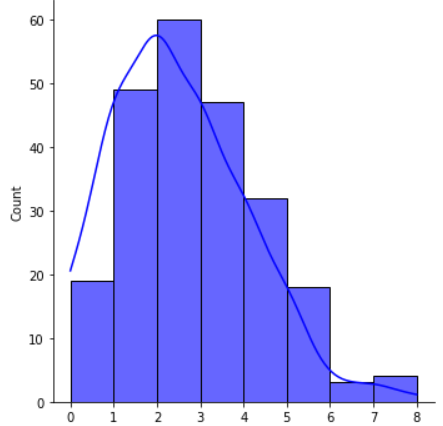
Right Skewed Distribution
Left Skewed Distribution,
Mean <Median < Mode
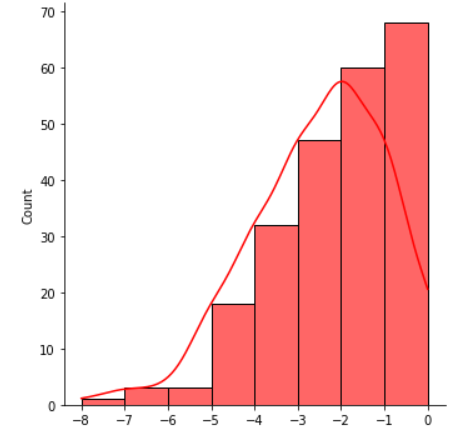
Left Skewed Distribution
33. Whether decision tree or random forest is more robust to the outliers.
Decision trees and random forests are both relatively robust to outliers. A random forest model is an ensemble of multiple decision trees so, the output of a random forest model is an aggregate of multiple decision trees.
So, when we average the results the chances of overfitting get reduced. Hence we can say that the random forest models are more robust to outliers.
34. What is the difference between L1 and L2 regularization? What is their significance?
L1 regularization: In L1 regularization also known as Lasso regularization in which we add the sum of absolute values of the weights of the model in the loss function. In L1 regularization weights for those features which are not at all important are penalized to zero so, in turn, we obtain feature selection by using the L1 regularization technique.
L2 regularization: In L2 regularization also known as Ridge regularization in which we add the square of the weights to the loss function. In both of these regularization methods, weights are penalized but there is a subtle difference between the objective they help to achieve.
In L2 regularization the weights are not penalized to 0 but they are near zero for irrelevant features. It is often used to prevent overfitting by shrinking the weights towards zero, especially when there are many features and the data is noisy.
35. What is a radial basis function? Explain its use.
RBF (radial basis function) is a real-valued function used in machine learning whose value only depends upon the input and fixed point called the center. The formula for the radial basis function is as follows:

Machine learning systems frequently use the RBF function for a variety of functions, including:
- RBF networks can be used to approximate complex functions. By training the network’s weights to suit a set of input-output pairs,
- RBF networks can be used for unsupervised learning to locate data groups. By treating the RBF centers as cluster centers,
- RBF networks can be used for classification tasks by training the network’s weights to divide inputs into groups based on how far from the RBF nodes they are.
It is one of the very famous kernels which is generally used in the SVM algorithm to map low dimensional data to a higher dimensional plane so, we can determine a boundary that can separate the classes in different regions of those planes with as much margin as possible.
36. Explain SMOTE method used to handle data imbalance.
The synthetic Minority Oversampling Technique is one of the methods which is used to handle the data imbalance problem in the dataset. In this method, we synthesized new data points using the existing ones from the minority classes by using linear interpolation. The advantage of using this method is that the model does not get trained on the same data. But the disadvantage of using this method is that it adds undesired noise to the dataset and can lead to a negative effect on the model’s performance.
37. Does the accuracy score always a good metric to measure the performance of a classification model?
No, there are times when we train our model on an imbalanced dataset the accuracy score is not a good metric to measure the performance of the model. In such cases, we use precision and recall to measure the performance of a classification model. Also, f1-score is another metric that can be used to measure performance but in the end, f1-score is also calculated using precision and recall as the f1-score is nothing but the harmonic mean of the precision and recall.
38. What is KNN Imputer?
We generally impute null values by the descriptive statistical measures of the data like mean, mode, or median but KNN Imputer is a more sophisticated method to fill the null values. A distance parameter is also used in this method which is also known as the k parameter. The work is somehow similar to the clustering algorithm. The missing value is imputed in reference to the neighborhood points of the missing values.
39. Explain the working procedure of the XGB model.
XGB model is an example of the ensemble technique of machine learning in this method weights are optimized in a sequential manner by passing them to the decision trees. After each pass, the weights become better and better as each tree tries to optimize the weights, and finally, we obtain the best weights for the problem at hand. Techniques like regularized gradient and mini-batch gradient descent have been used to implement this algorithm so, that it works in a very fast and optimized manner.
40. What is the purpose of splitting a given dataset into training and validation data?
The main purpose is to keep some data left over on which the model has not been trained so, that we can evaluate the performance of our machine learning model after training. Also, sometimes we use the validation dataset to choose among the multiple state-of-the-art machine learning models. Like we first train some models let’s say LogisticRegression, XGBoost, or any other than test their performance using validation data and choose the model which has less difference between the validation and the training accuracy.
41. Explain some methods to handle missing values in that data.
Some of the methods to handle missing values are as follows:
- Removing the rows with null values may lead to the loss of some important information.
- Removing the column having null values if it has very less valuable information. it may lead to the loss of some important information.
- Imputing null values with descriptive statistical measures like mean, mode, and median.
- Using methods like KNN Imputer to impute the null values in a more sophisticated way.
42. What is the difference between k-means and the KNN algorithm?
k-means algorithm is one of the popular unsupervised machine learning algorithms which is used for clustering purposes. But the KNN is a model which is generally used for the classification task and is a supervised machine learning algorithm. The k-means algorithm helps us to label the data by forming clusters within the dataset.
43. What is Linear Discriminant Analysis?
LDA is a supervised machine learning dimensionality reduction technique because it uses target variables also for dimensionality reduction. It is commonly used for classification problems. The LDA mainly works on two objectives:
- Maximize the distance between the means of the two classes.
- Minimize the variation within each class.
44. How can we visualize high-dimensional data in 2-d?
One of the most common and effective methods is by using the t-SNE algorithm which is a short form for t-Distributed Stochastic Neighbor Embedding. This algorithm uses some non-linear complex methods to reduce the dimensionality of the given data. We can also use PCA or LDA to convert n-dimensional data to 2 – dimensional so, that we can plot it to get visuals for better analysis. But the difference between the PCA and t-SNE is that the former tries to preserve the variance of the dataset but the t-SNE tries to preserve the local similarities in the dataset.
45. What is the reason behind the curse of dimensionality?
As the dimensionality of the input data increases the amount of data required to generalize or learn the patterns present in the data increases. For the model, it becomes difficult to identify the pattern for every feature from the limited number of datasets or we can say that the weights are not optimized properly due to the high dimensionality of the data and the limited number of examples used to train the model. Due to this after a certain threshold for the dimensionality of the input data, we have to face the curse of dimensionality.
46. Whether the metric MAE or MSE or RMSE is more robust to the outliers.
Out of the above three metrics, MAE is robust to the outliers as compared to the MSE or RMSE. The main reason behind this is because of Squaring the error values. In the case of an outlier, the error value is already high and then we squared it which results in an explosion in the error values more than expected and creates misleading results for the gradient.
47. Why removing highly correlated features are considered a good practice?
When two features are highly correlated, they may provide similar information to the model, which may cause overfitting. If there are highly correlated features in the dataset then they unnecessarily increase the dimensionality of the feature space and sometimes create the problem of the curse of dimensionality. If the dimensionality of the feature space is high then the model training may take more time than expected, it will increase the complexity of the model and chances of error. This somehow also helps us to achieve data compression as the features have been removed without much loss of data.
48. What is the difference between the content-based and collaborative filtering algorithms of recommendation systems?
In a content-based recommendation system, similarities in the content and services are evaluated, and then by using these similarity measures from past data we recommend products to the user. But on the other hand in collaborative filtering, we recommend content and services based on the preferences of similar users. For example, if one user has taken A and B services in past and a new user has taken service A then service A will be recommended to him based on the other user’s preferences.
Conclusion
Machine learning is a rapidly advancing field with new concepts constantly emerging. To stay up to date, join communities, attend conferences, and read research papers. By doing so, you can enhance your understanding and effectively tackle machine learning interviews. Continuous learning and active involvement are key to success in this dynamic field.
Like Article
Suggest improvement
Share your thoughts in the comments
Please Login to comment...