Levels in Data Flow Diagrams (DFD)
Last Updated :
24 Apr, 2023
In Software engineering DFD(data flow diagram) can be drawn to represent the system of different levels of abstraction. Higher-level DFDs are partitioned into low levels-hacking more information and functional elements. Levels in DFD are numbered 0, 1, 2 or beyond. Here, we will see mainly 3 levels in the data flow diagram, which are: 0-level DFD, 1-level DFD, and 2-level DFD.
Data Flow Diagrams (DFD) are graphical representations of a system that illustrate the flow of data within the system. DFDs can be divided into different levels, which provide varying degrees of detail about the system. The following are the four levels of DFDs:
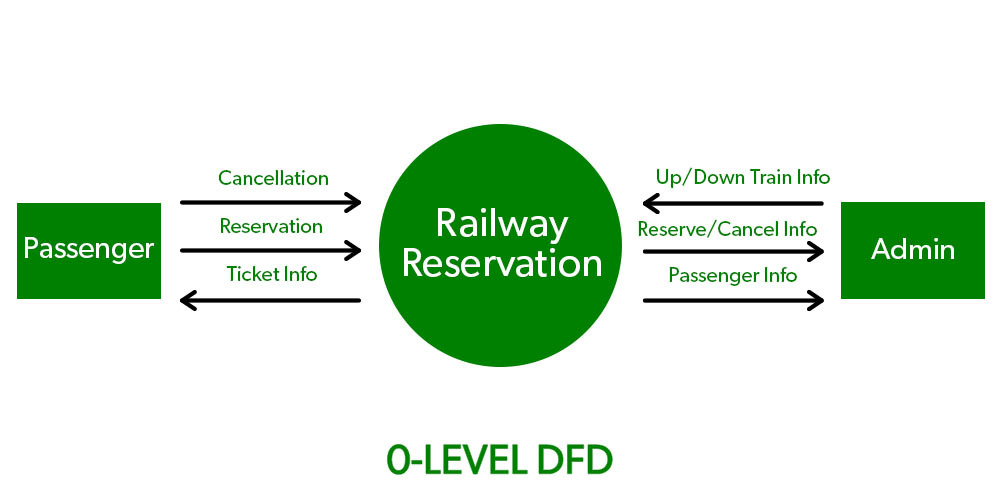
- Level 0 DFD: This is the highest-level DFD, which provides an overview of the entire system. It shows the major processes, data flows, and data stores in the system, without providing any details about the internal workings of these processes.
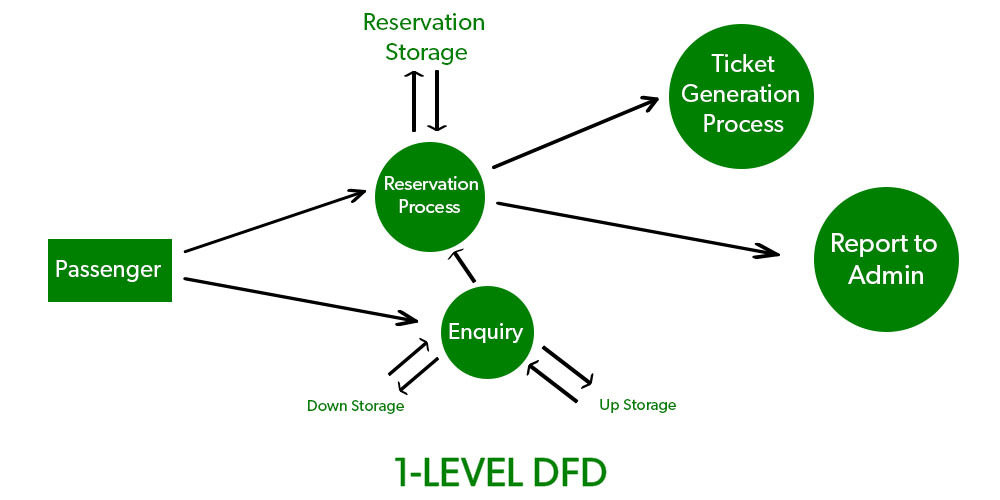
- Level 1 DFD: This level provides a more detailed view of the system by breaking down the major processes identified in the level 0 DFD into sub-processes. Each sub-process is depicted as a separate process on the level 1 DFD. The data flows and data stores associated with each sub-process are also shown.
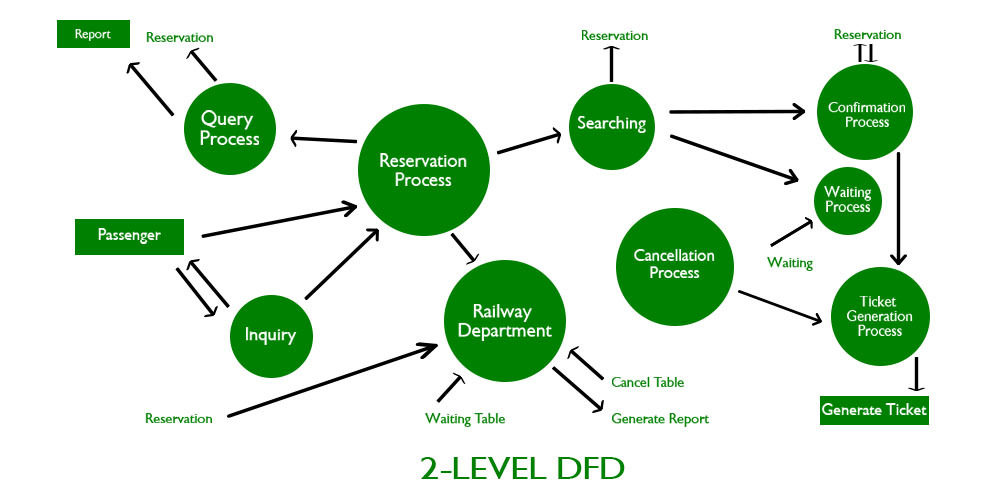
- Level 2 DFD: This level provides an even more detailed view of the system by breaking down the sub-processes identified in the level 1 DFD into further sub-processes. Each sub-process is depicted as a separate process on the level 2 DFD. The data flows and data stores associated with each sub-process are also shown.
- Level 3 DFD: This is the most detailed level of DFDs, which provides a detailed view of the processes, data flows, and data stores in the system. This level is typically used for complex systems, where a high level of detail is required to understand the system. Each process on the level 3 DFD is depicted with a detailed description of its input, processing, and output. The data flows and data stores associated with each process are also shown.
The choice of DFD level depends on the complexity of the system and the level of detail required to understand the system. Higher levels of DFD provide a broad overview of the system, while lower levels provide more detail about the system’s processes, data flows, and data stores. A combination of different levels of DFD can provide a complete understanding of the system.
- 0-level DFD: It is also known as a context diagram. It’s designed to be an abstraction view, showing the system as a single process with its relationship to external entities. It represents the entire system as a single bubble with input and output data indicated by incoming/outgoing arrows.
 1-level DFD: In 1-level DFD, the context diagram is decomposed into multiple bubbles/processes. In this level, we highlight the main functions of the system and breakdown the high-level process of 0-level DFD into subprocesses.
- 2-level DFD: 2-level DFD goes one step deeper into parts of 1-level DFD. It can be used to plan or record the specific/necessary detail about the system’s functioning.
Advantages of using Data Flow Diagrams (DFD) include:
- Easy to understand: DFDs are graphical representations that are easy to understand and communicate, making them useful for non-technical stakeholders and team members.
- Improves system analysis: DFDs are useful for analyzing a system’s processes and data flow, which can help identify inefficiencies, redundancies, and other problems that may exist in the system.
- Supports system design: DFDs can be used to design a system’s architecture and structure, which can help ensure that the system is designed to meet the requirements of the stakeholders.
- Enables testing and verification: DFDs can be used to identify the inputs and outputs of a system, which can help in the testing and verification of the system’s functionality.
- Facilitates documentation: DFDs provide a visual representation of a system, making it easier to document and maintain the system over time.
Disadvantages of using DFDs include:
- Can be time-consuming: Creating DFDs can be a time-consuming process, especially for complex systems.
- Limited focus: DFDs focus primarily on the flow of data in a system, and may not capture other important aspects of the system, such as user interface design, system security, or system performance.
- Can be difficult to keep up-to-date: DFDs may become out-of-date over time as the system evolves and changes.
- Requires technical expertise: While DFDs are easy to understand, creating them requires a certain level of technical expertise and familiarity with the system being analyzed.
- Overall, the benefits of using DFDs outweigh the disadvantages. However, it is important to recognize the limitations of DFDs and use them in conjunction with other tools and techniques to analyze and design complex software systems.
Like Article
Suggest improvement
Share your thoughts in the comments
Please Login to comment...