Least Angle Regression (LARS)
Last Updated :
25 Jan, 2023
Regression is a supervised machine learning task that can predict continuous values (real numbers), as compared to classification, that can predict categorical or discrete values. Before we begin, if you are a beginner, I highly recommend this article.
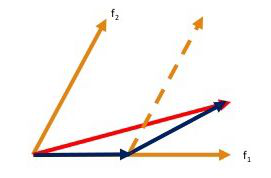
Least Angle Regression (LARS) is an algorithm used in regression for high dimensional data (i.e., data with a large number of attributes). Least Angle Regression is somewhat similar to forward stepwise regression. Since it is used with data that has lots of attributes, at each step, LARS finds the attribute which is most highly correlated to the target value. There may be more than one attribute that has the same correlation. In this scenario, LARS averages the attributes and proceeds in a direction that is at the same angle to the attributes. This is exactly why this algorithm is called Least Angle regression. Basically, LARS makes leaps in the most optimally calculated direction without overfitting the model.
Algorithm:
- Normalize all values to have zero mean and unit variance.
- Find a variable that is most highly correlated to the residual. Move the regression line in this direction until we reach another variable that has the same or higher correlation.
Note : Residual is the difference between the observed value and the predicted value. Variable, here implies an attribute.
- When we have two variables that have the same correlation, move the regression line at an angle that is in between (i.e., least angle between the two variables).
- Continue this until all of our data is exhausted or until you think the model is big and ‘general’ enough.
Mathematically, LARS works as follows :
- All coefficients, ‘B’ are set to 0.
- The predictor, xj is found that is most correlated to y.
- Increase the coefficient Bj in the direction that is most correlated with y and stop when you find some other predictor xk the has equal or higher correlation than xj.
- Extend (Bj, Bk) in a direction that is equiangular (has the same angle) to both xj and xk.
- Continue and repeat until all predictors are in the model.
Implementation of LARS in Python3:
For this example, we will be using the Boston housing dataset that has the median value of homes in the Boston Massachusetts area. You can learn more about this dataset here.
For evaluation, we will be using the r2 score. The best possible r2 score is 1.0. It can also be negative and is 0, when the predictor always predicts a constant value, regardless of values of attributes.
Code:
python3
from sklearn.datasets import load_boston
from sklearn.linear_model import LassoLars
from sklearn.metrics import r2_score
from sklearn.model_selection import train_test_split
dataset = load_boston()
X = dataset.data
y = dataset.target
X_train, X_test, y_train, y_test = train_test_split(X, y,
test_size = 0.15, random_state = 42)
regressor = LassoLars(alpha = 0.1)
regressor.fit(X_train, y_train)
prediction = regressor.predict(X_test)
print(f"r2 Score of test set : {r2_score(y_test, prediction)}")
|
Output:
r2 Score of test set : 0.6815908068381828
We have achieved an r2 score of approximately 0.6816, which is actually quite good.
Advantages of using LARS:
- Computationally as fast as forward selection but may sometimes be more accurate.
- Numerically very efficient when the number of features is much larger than the number of data instances.
- It can easily be modified to produce solutions for other estimators.
Disadvantages of using LARS:
- LARS is highly sensitive to noise and can produce unpredictable results sometimes.
Reference:
Like Article
Suggest improvement
Share your thoughts in the comments
Please Login to comment...