Leaflet package in R
Last Updated :
26 Mar, 2024
The leaflet is one of the most popular open-source JavaScript libraries for mobile-friendly interactive maps. It’s used widely by many top organizations in the world. To use leaflet in r functionality in the R Programming Language, we have the leaflet package library. The leaflet in r package is an easy-to-use library that is designed with simplicity, performance, and usability all around.
Features of the leaflet in R
- Supports interactive maps that provide features like panning and zooming.
- Supports various elements for the composition of maps such as Map tiles, Markers, Polygons, Lines, Popups, and GeoJSON.
- Supports full dynamic map creation from the R Console itself.
- Easy to embed map objects in various markdown files.
- Can also display maps in non-spherical Mercator projections
- Augment map features using chosen plugins from the leaflet in r plugins repository
Installation of leaflet in R
We can install the leaflet library in the R Language by using:
# installs the leaflet package
install.packages("leaflet")
Run the above command in the R console and select desired cran mirror to install the Leaflet R Package.
Creating Interactive maps using leaflet leaflet in R
To create a map widget using the leaflet package in the R Language we use the leaflet() function. The leaflet() function returns a map object that can be viewed in itself or can be modified by adding more layers. The basic leaflet widget shows an empty map widget with no tiles or markers.
Syntax: map <- leaflet()
Basic map object made by using the leaflet() function
R
# load leaflet library
library(leaflet)

# create map widget
map <- leaflet()

# print map widget
map
Output:

Adding tiles to map
Since above code creates a map widget that is empty. To add tiles to it for the creation of the desired map we use the addTiles() function of the leaflet package. By default, if no argument is passed it creates an OpenStreetMap map tile on top of the map widget. For custom map tile we pass that map as an argument to the addTiles() function.
Syntax: map <- leaflet() %>%addTiles()
Basic map with OpenStreetMap tile
R
# load leaflet library
library(leaflet)

# create map widget with OpenStreetMap tile
map <- leaflet() %>%
       addTiles()

# print map widget
map
Output:

Adding Markers on Map
Now since we have created a basic map, it in itself is not that useful. we can now add markers on the map using the addMarkers() function of the leaflet package. we can add as many markers as we require by just adding new layers.
Syntax: map <- leaflet() %>%addTiles() %>% addMarkers( lng, lat, popup)
Parameters:
- lng: determines the longitude of the marker position
- lat: determines the latitude of the maeker position
- popup: determines the text that would be shown on marker popup
Interactive map with a marker in Delhi India
R
# load leaflet library
library(leaflet)

# create map widget with OpenStreetMap tile
# added marker at Delhi India
map <- leaflet() %>%
       addTiles() %>%
       addMarkers(lng=77.1025, lat=28.7041,
                  popup="Delhi, India")

# print map widget
map
Output:

Interactive map with Multiple locations
R
# Load necessary libraries
library(leaflet)

# Create a leaflet map
india_map <- leaflet() %>%
  addTiles() %>%
  setView(lng = 78.9629, lat = 20.5937, zoom = 5)
# Sample data with top cities of India
cities_data <- data.frame(
  city = c("Mumbai", "Delhi", "Bangalore", "Hyderabad", "Chennai", "Kolkata"),
  lat = c(19.0760, 28.6139, 12.9716, 17.3850, 13.0827, 22.5726),
  lng = c(72.8777, 77.2090, 77.5946, 78.4867, 80.2707, 88.3639),
  population = c(12442373, 11034555, 8443675, 6772291, 4681087, 4486679)
)

# Add circle markers for each city
india_map <- india_map %>%
  addCircleMarkers(
    data = cities_data,
    lng = ~lng,
    lat = ~lat,
    radius = ~sqrt(population) * 0.01,
    color = "orange",
    fillOpacity = 0.7,
    popup = ~paste("City: ", city, "<br>Population: ", population)
  )

# Display the map
india_map
Output:
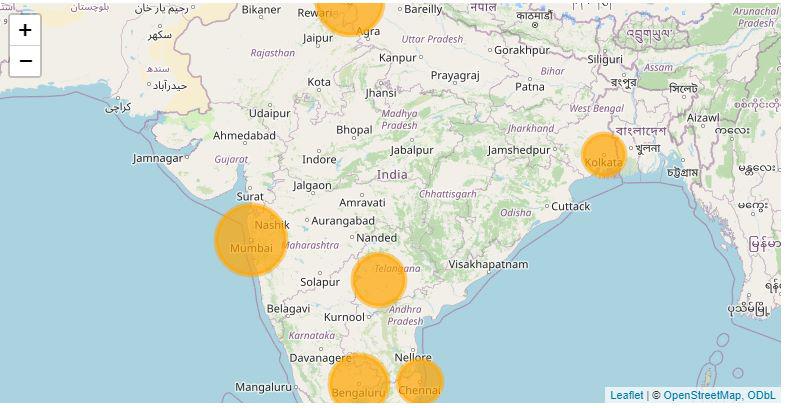
Leaflet in R
Layer Control
We can add multiple layers to the leaflet in r map using addTiles() or addMarker() function. Now if we want to give the user a choice of which layer he/she wants to look at, we can do that by using layer control. Layers can be assigned to named groups. To name a group in the leaflet we add group argument to that layer. Now, these groups can be toggled on and off by the user. The Base Groups that form the basics of the map for example tiles are selected with radio buttons so that you can only choose one at a time, and the Overlay Groups that can have multiple layers active at the same time get checkboxes.
To implement layers control, add group names to individual layers with the group = argument AND add the layers control layer using addLayersControl().
Syntax: leaflet() %> addTiles(group = “One”) %>% addProviderTiles(providers$Esri.WorldImagery, group = “Two”) %>% addLayersControl(baseGroups = c(“One”, “Two”) options = layersControlOptions(collapsed = FALSE))
Basic leaflet map with two options for tiles and two markers with checkboxes
R
# Load library
library(leaflet)
library(dplyr)
# Draw map
leaflet() %>%
  # Add first tile
  addTiles(group="One") %>%
  # Add second tile
  addProviderTiles(providers$Esri.WorldImagery, group="Two") %>%
  # Add first marker
  addMarkers(lng=25.505206, lat=65.9767231, group="mark1") %>%
  # Add second marker
  addMarkers(lng=-45.445206, lat=45.5327231, group="mark2") %>%
  # Add Layer controls
  addLayersControl(baseGroups=c("One", "Two"),
                   overlayGroups=c("mark1", "mark2"),
                   options=layersControlOptions(collapsed=FALSE))
Output:

Plot data on top of map
Spatial objects in your R environment can also be added as map layers, provided that they have a CRS defined with a datum. We can use those data points on top of the leaflet in r map using the addMarkers() or the addPloygons() function depending on the type of dataset. If the dataset is single-dimensional we use markers and for multidimensional data we use polygons.
R
# Load necessary libraries
library(leaflet)

# Create a leaflet map
my_map <- leaflet() %>%
  addTiles() %>%
  setView(lng = 0, lat = 0, zoom = 2)

# Sample data
data <- data.frame(
  lng = c(0, 10, -20),
  lat = c(0, 15, -10),
  value = c(100, 200, 150)
)

# Add circle markers based on the sample data
my_map <- my_map %>%
  addCircleMarkers(
    data = data,
    lng = ~lng,
    lat = ~lat,
    radius = ~sqrt(value) * 2,
    color = "red",
    fillOpacity = 0.7,
    popup = ~paste("Value: ", value)
  )

# Display the map
my_map
Output:

Conclusion
The leaflet in R provides a versatile and powerful tool for creating interactive and visually appealing maps. leaflet in r seamlessly integrates with the popular Leaflet JavaScript library, allowing R users to generate interactive maps with ease. Here are some key points to conclude the benefits and features of the leaflet package.
Like Article
Suggest improvement
Share your thoughts in the comments
Please Login to comment...