Ladder Graph Using Networkx Module in Python
Last Updated :
29 Apr, 2021
In this article, we are going to see the ladder graph using Python. It is a graph that looks like ladders used commonly with every node attached to two other nodes in a specific manner. We can obtain a ladder graph by joining two-path graphs of n nodes each by each node connected with a corresponding node in another path graph.
Representation:
Below attached is an image of the L4 (n) Ladder Graph that Returns the Ladder graph of length 4(n).
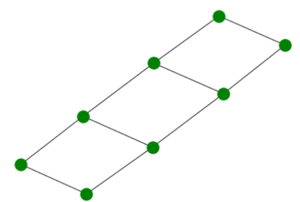
Ladder Graph
Properties of the ladder graph:
- It is an undirected graph.
- It is Planar
- An Ln ladder graph has 2n. nodes.
- Chromatic number of a ladder graph is 2.
- An Ln ladder graph has 3n-2 edges.
- It is a Hamiltonian graph
- It is a Connected graph.
- The ladder graph is a Bipartite graph.
We will use the networkx module for realizing a Ladder graph. It comes with an inbuilt function networkx.ladder_graph() and can be illustrated using the networkx.draw() method.
Syntax: networkx.draw(G, node_size, node_color)
Parameters:
- G: It refers to the ladder graph object
- node_size: It refers to the size of nodes.
- node_color: It refers to color of the nodes.
Below are some examples to depict how to illustrate a Ladder graph in Python:
Approach:
- We will import the required networkx module.
- After that, we will initialize a number of nodes to 5.
- We will create graph object G using ladder_graph() function.
- We will realize the graph using nx.draw() function.
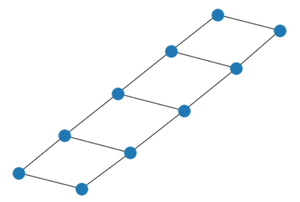
Example 1:
Python3
import networkx
n = 5
G = networkx.ladder_graph(n)
networkx.draw(G)
|
Output:
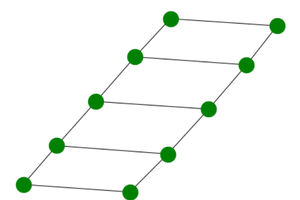
Example 2: Making color of nodes green and increasing size by passing extra arguments to nx.draw() function as discussed above.
Approach:
- We will import the required networkx module.
- After that, we will initialize number of nodes to 5.
- We will create graph object G using ladder_graph() function.
- We will realize the graph using nx.draw() function.
- We will make the color of nodes green and increasing size by passing extra arguments to nx.draw()
Python3
import networkx
G = networkx.ladder_graph(5)
networkx.draw(G, node_size = 500,
node_color = 'green')
|
Output:
Like Article
Suggest improvement
Share your thoughts in the comments
Please Login to comment...