Labeling line plots with geomtextpath package in R
Last Updated :
27 Jan, 2022
In this article, we are going to see how to use direct Labeling on line plots with geomtextpath Package in R Programming Language.
Geomtextpath is used to customize the labeling and using geomtextpath graph text follows any path, and it will remain correctly spaced and angled, even if you change the size and aspect ratio of your plotting device.
Installation
To install this package type the below command in the terminal.
install.packages("remotes")
remotes::install_github("AllanCameron/geomtextpath")
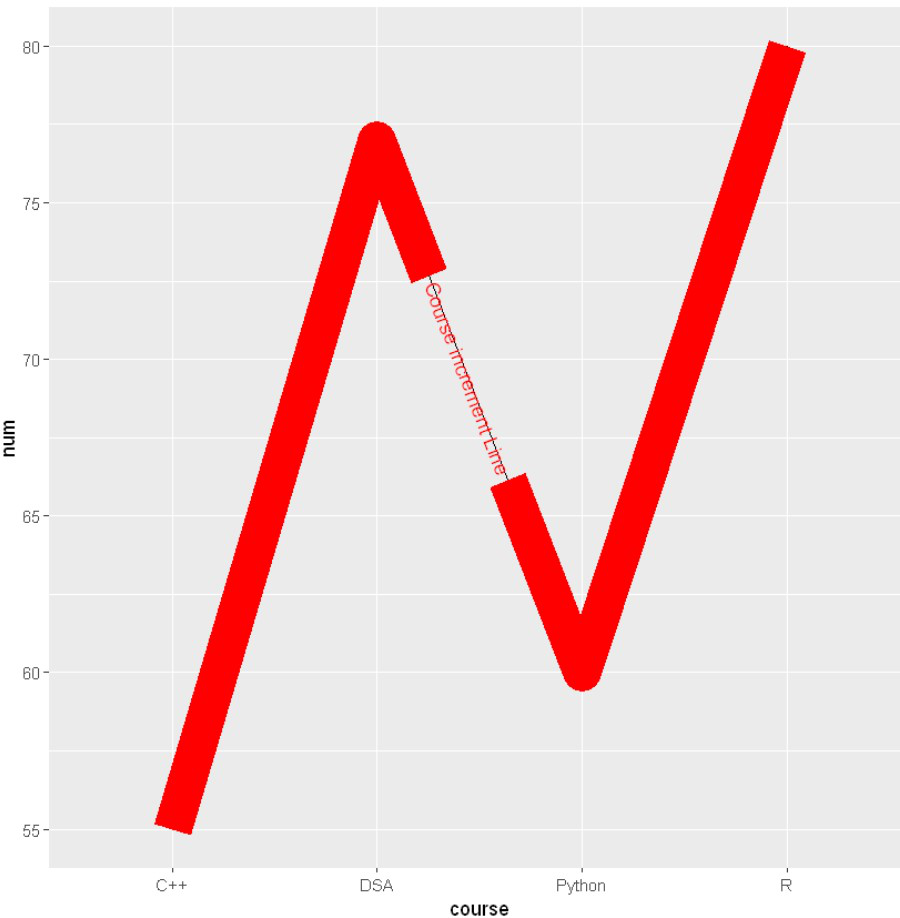
Method 1: With geom_textline() methods
Here, we are creating a dataframe and plotting a line plot using ggplot2 and then using geom_textline() methods from geomtextpath.
R
library(ggplot2)
library(geomtextpath)
val <-data.frame(course=c('DSA','C++','R','Python'),
num=c(77,55,80,60))
ggplot(data=val, aes(x=course, y=num, group=1)) +
geom_line()+
geom_textline(label = "Course increment Line",
color = "Red",
linewidth=10)
geom_point()
|
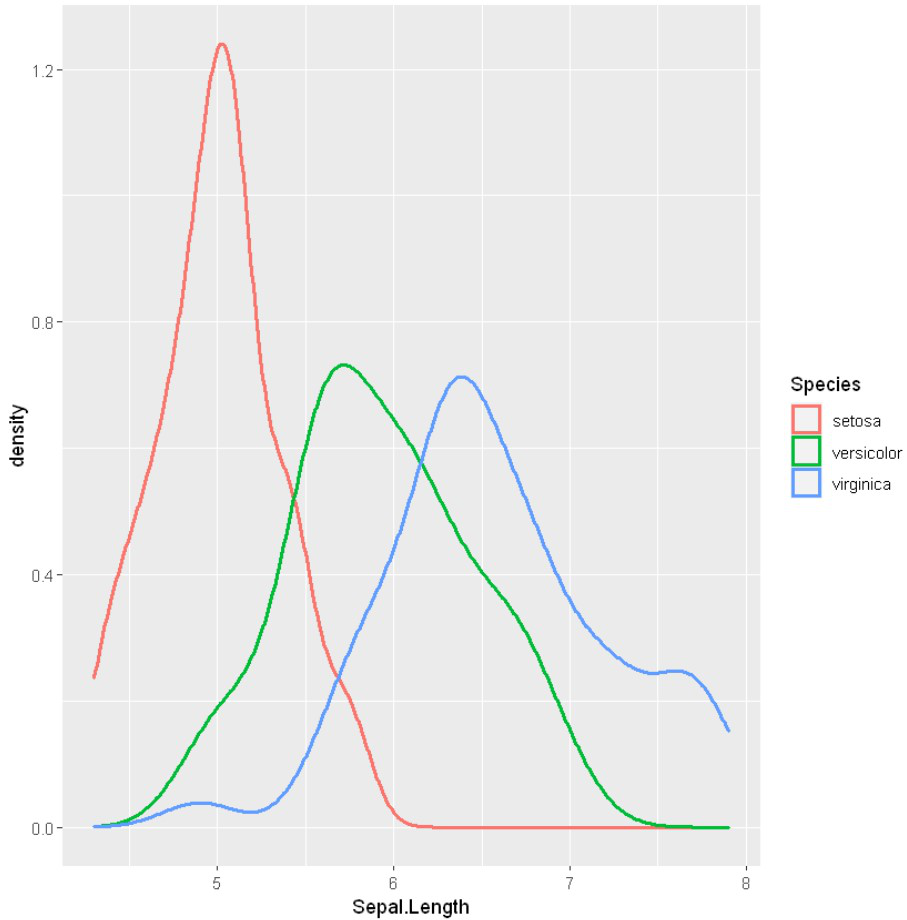
Method 2: With geom_density() methods
geom_density() is also used to add new labeling, first, we will create density lines and then apply geom_density.
R
library("ggplot2")
ggplot(iris, aes(Sepal.Length, colour = Species)) +
geom_density(size=1)
|
Output:
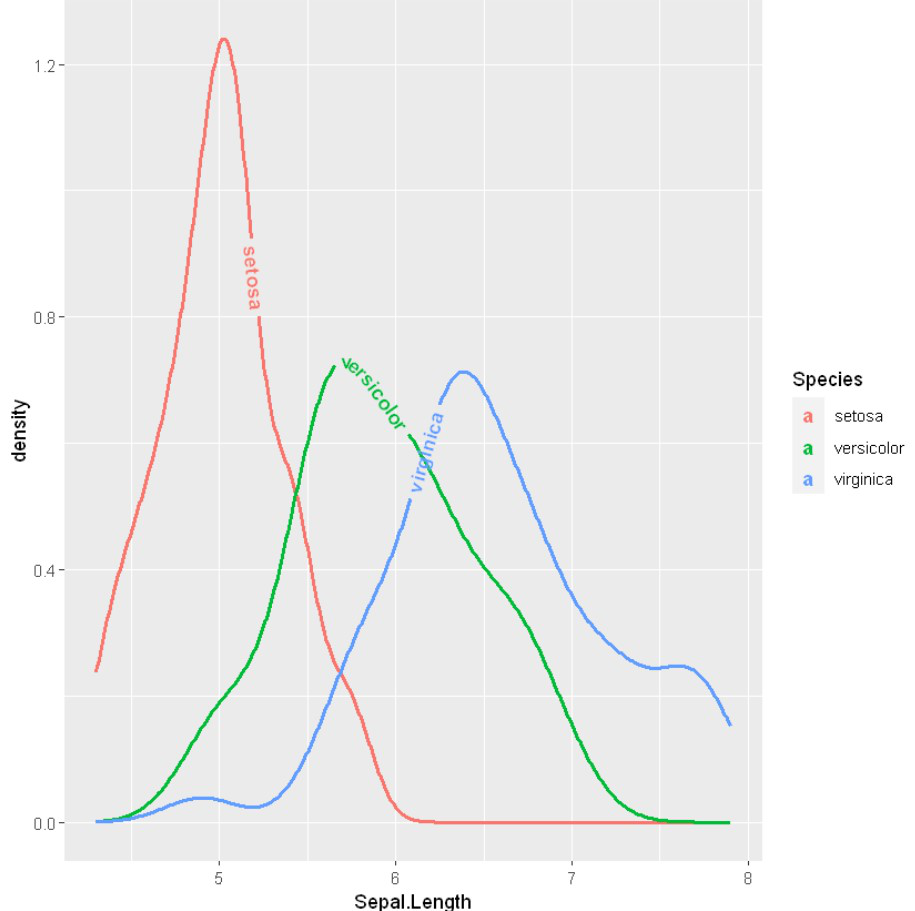
Method 3: With geomtextdensity() methods
Here we use the iris dataset to create density line and then we will use geomtextdensity() methods from geomtextpath
R
library("ggplot2")
library(geomtextpath)
ggplot(iris, aes(Sepal.Length, colour = Species, label = Species)) +
geom_textdensity(fontface = 2,
linewidth=1)
|
Output:
Like Article
Suggest improvement
Share your thoughts in the comments
Please Login to comment...