KNN Classifier in R Programming
Last Updated :
20 Dec, 2023
K-Nearest Neighbor or KNN is a Supervised Non-linear classification algorithm. KNN in R Programming Language is a Non-parametric algorithm i.e. it doesn’t make any assumption about underlying data or its distribution.
KNN in R is one of the simplest and most widely used algorithms which depends on its k value(Neighbors) and finds its applications in many industries like the finance industry, healthcare industry, etc.
In KNN in R algorithm, K specifies the number of neighbors and its algorithm is as follows:
- Choose the number K of the neighbor.
- Take the K Nearest Neighbor of unknown data point according to distance.
- Among the K-neighbors, Count the number of data points in each category.
- Assign the new data point to a category, where you counted the most neighbors.
For the Nearest Neighbor classifier, the distance between two points is expressed in the form of
Euclidean Distance
Consider a dataset containing two features Red and Blue and we classify them. Here K is 5 i.e. we are considering 5 neighbors according to Euclidean distance.
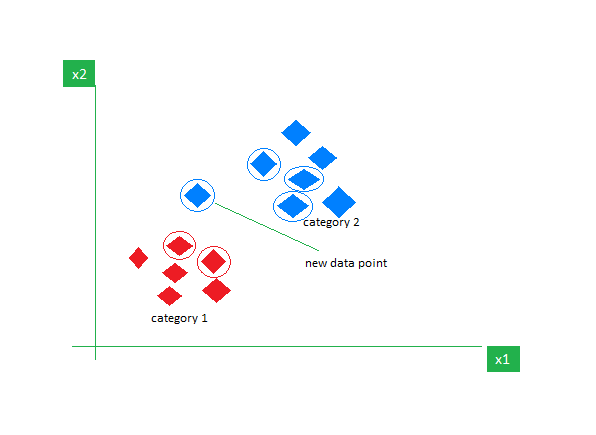
So, when a new data point enters, out of 5 neighbors, 3 are Blue and 2 are Red. We assign the new data point to the category with most neighbors i.e Blue.
The Dataset
Iris dataset consists of 50 samples from each of 3 species of Iris(Iris setosa, Iris virginica, Iris versicolor) and a multivariate dataset introduced by British statistician and biologist Ronald Fisher in his 1936 paper The use of multiple measurements in taxonomic problems. Four features were measured from each sample i.e length and width of the sepals and petals and based on the combination of these four features, Fisher developed a linear discriminant model to distinguish the species from each other.
Output:
'data.frame':    150 obs. of  5 variables:
 $ Sepal.Length: num  5.1 4.9 4.7 4.6 5 5.4 4.6 5 4.4 4.9 ...
 $ Sepal.Width : num  3.5 3 3.2 3.1 3.6 3.9 3.4 3.4 2.9 3.1 ...
 $ Petal.Length: num  1.4 1.4 1.3 1.5 1.4 1.7 1.4 1.5 1.4 1.5 ...
 $ Petal.Width : num  0.2 0.2 0.2 0.2 0.2 0.4 0.3 0.2 0.2 0.1 ...
 $ Species     : Factor w/ 3 levels "setosa","versicolor",..: 1 1 1 1 1 1 1 1 1 1 ...
Performing KNN in R
Using the KNN in R algorithm on the dataset which includes 11 persons and 6 variables or attributes.
R
install.packages("e1071")
install.packages("caTools")
install.packages("class")
library(e1071)
library(caTools)
library(class)
data(iris)
head(iris)
|
Output:
  Sepal.Length Sepal.Width Petal.Length Petal.Width Species
1          5.1         3.5          1.4         0.2  setosa
2          4.9         3.0          1.4         0.2  setosa
3          4.7         3.2          1.3         0.2  setosa
4          4.6         3.1          1.5         0.2  setosa
5          5.0         3.6          1.4         0.2  setosa
6          5.4         3.9          1.7         0.4  setosa
Splitting data into train and test data
R
split <- sample.split(iris, SplitRatio = 0.7)
train_cl <- subset(iris, split == "TRUE")
test_cl <- subset(iris, split == "FALSE")
train_scale <- scale(train_cl[, 1:4])
test_scale <- scale(test_cl[, 1:4])
head(train_scale)
head(test_scale)
|
Output:
  Sepal.Length Sepal.Width Petal.Length Petal.Width
1   -0.9194427  0.98658863    -1.344451   -1.353762
2   -1.1631831 -0.14597485    -1.344451   -1.353762
4   -1.5287936  0.08053785    -1.287510   -1.353762
6   -0.5538322  1.89263942    -1.173627   -1.089470
7   -1.5287936  0.76007594    -1.344451   -1.221616
9   -1.7725339 -0.37248755    -1.344451   -1.353762

head(test_scale)

   Sepal.Length Sepal.Width Petal.Length Petal.Width
3   -1.33191360   0.3559334    -1.367732   -1.240423
5   -0.97726205   1.2844553    -1.311982   -1.240423
8   -0.97726205   0.8201944    -1.256232   -1.240423
10  -1.09547923   0.1238029    -1.256232   -1.369410
13  -1.21369641  -0.1083276    -1.311982   -1.369410
15  -0.03152458   2.2129772    -1.423482   -1.240423
Fitting KNN Model
R
classifier_knn <- knn(train = train_scale,
test = test_scale,
cl = train_cl$Species,
k = 1)
classifier_knn
|
Output:
 [1] setosa     setosa     setosa     setosa     setosa     setosa
 [7] setosa     setosa     setosa     setosa     setosa     setosa
[13] setosa     setosa     setosa     setosa     setosa     setosa
[19] setosa     setosa     versicolor virginica  versicolor versicolor
[25] versicolor versicolor versicolor versicolor virginica  versicolor
[31] virginica  versicolor versicolor versicolor versicolor versicolor
[37] versicolor versicolor versicolor versicolor virginica  virginica
[43] virginica  virginica  virginica  virginica  virginica  versicolor
[49] virginica  virginica  virginica  virginica  virginica  versicolor
[55] virginica  virginica  virginica  virginica  virginica  virginica
Levels: setosa versicolor virginica
Model classifier_knn(k=1): The KNN model is fitted with a train, test, and k value. Also, the Classifier Species feature is fitted in the model.
Confusiin Matrix
R
cm <- table(test_cl$Species, classifier_knn)
cm
|
Output:
            classifier_knn
             setosa versicolor virginica
  setosa         20          0         0
  versicolor      0         17         3
  virginica       0          2        18
Confusion Matrix: So, 20 Setosa are correctly classified as Setosa. Out of 20 Versicolor, 17 Versicolor are correctly classified as Versicolor and 3 are classified as virginica. Out of 20 virginica, 17 virginica are correctly classified as virginica and 3 are classified as Versicolor.
Model Evaluation for different K values
R
misClassError <- mean(classifier_knn != test_cl$Species)
print(paste('Accuracy =', 1-misClassError))
classifier_knn <- knn(train = train_scale,
test = test_scale,
cl = train_cl$Species,
k = 3)
misClassError <- mean(classifier_knn != test_cl$Species)
print(paste('Accuracy =', 1-misClassError))
classifier_knn <- knn(train = train_scale,
test = test_scale,
cl = train_cl$Species,
k = 5)
misClassError <- mean(classifier_knn != test_cl$Species)
print(paste('Accuracy =', 1-misClassError))
classifier_knn <- knn(train = train_scale,
test = test_scale,
cl = train_cl$Species,
k = 7)
misClassError <- mean(classifier_knn != test_cl$Species)
print(paste('Accuracy =', 1-misClassError))
classifier_knn <- knn(train = train_scale,
test = test_scale,
cl = train_cl$Species,
k = 15)
misClassError <- mean(classifier_knn != test_cl$Species)
print(paste('Accuracy =', 1-misClassError))
classifier_knn <- knn(train = train_scale,
test = test_scale,
cl = train_cl$Species,
k = 19)
misClassError <- mean(classifier_knn != test_cl$Species)
print(paste('Accuracy =', 1-misClassError))
|
Output:
[1] "Accuracy = 0.916666666666667"

K = 3

[1] "Accuracy = 0.966666666666667"

K = 5

[1] "Accuracy = 0.966666666666667"

K = 7

[1] "Accuracy = 0.966666666666667"

K = 15

[1] "Accuracy = 0.966666666666667"

K = 19

[1] "Accuracy = 0.966666666666667"
The model achieved 95% accuracy with k is 19 which is more than when k was 1, 3, 5, and 7. Its same accuracy when k was 15 which means now increasing k values doesn’t affect the accuracy.
So, K Nearest Neighbor is widely used in the industry.
R
library(ggplot2)
k_values <- c(1, 3, 5, 7, 15, 19)
accuracy_values <- sapply(k_values, function(k) {
classifier_knn <- knn(train = train_scale,
test = test_scale,
cl = train_cl$Species,
k = k)
1 - mean(classifier_knn != test_cl$Species)
})
accuracy_data <- data.frame(K = k_values, Accuracy = accuracy_values)
ggplot(accuracy_data, aes(x = K, y = Accuracy)) +
geom_line(color = "lightblue", size = 1) +
geom_point(color = "lightgreen", size = 3) +
labs(title = "Model Accuracy for Different K Values",
x = "Number of Neighbors (K)",
y = "Accuracy") +
theme_minimal()
|
Output:

KNN Classifier in R Programming
- Model Evaluation:(k=1) The model achieved 90% accuracy with k is 1.
- (K=3) The model achieved 88.33% accuracy with k is 3 which is lower than when k was 1.
- (K=5) The model achieved 91.66% accuracy with k is 5 which is more than when k was 1 and 3.
- (K=7) The model achieved 93.33% accuracy with k is 7 which is more than when k was 1, 3, and 5.
- (K=15) The model achieved 95% accuracy with k is 15 which is more than when k was 1, 3, 5, and 7.
- (K=19) The model achieved 95% accuracy with k is 19 which is more than when k was 1, 3, 5, and 7.
Its same accuracy when k was 15 which means now increasing k values doesn’t affect the accuracy. So, K Nearest Neighbor is widely used in the industry.
Like Article
Suggest improvement
Share your thoughts in the comments
Please Login to comment...