K- means clustering with SciPy
Last Updated :
10 Feb, 2023
Prerequisite: K-Means clustering
The K-Means clustering is one of the partitioning approaches and each cluster will be represented with a calculated centroid. All the data points in the cluster will have a minimum distance from the computed centroid.
Scipy is an open-source library that can be used for complex computations. It is mostly used with NumPy arrays. It can be installed by running the command given below.
pip install scipy
It has dedicated packages for the process of clustering. There are two modules that can offer clustering methods.
- cluster.vq
- cluster.hierarchy
cluster.vq
This module gives the feature of vector quantization to use with the K-Means clustering method. The quantization of vectors plays a major role in reducing the distortion and improving the accuracy. Mostly the distortion here is calculated using the Euclidean distance between the centroid and each vector. Based on this the vector of data points are assigned to a cluster.
cluster.hierarchy
This module provides methods for general hierarchical clustering and its types such as agglomerative clustering. It has various routines that can be used for applying statistical methods on the hierarchies, visualizing the clusters, plotting the clusters, checking linkages in the clusters, and also checking whether two different hierarchies are equivalent.
In this article, cluster.vq module will be used to carry out the K-Means clustering.
K-Means clustering with Scipy library
The K-means clustering can be done on given data by executing the following steps.
- Normalize the data points.
- Compute the centroids (referred to as code and the 2D array of centroids is referred to as code book).
- Form clusters and assign the data points (referred to as mapping from code book).
cluster.vq.whiten()
This method is used to normalize the data points. Normalization is very important when the attributes considered are of different units. For example, if the length is given in meters and breadth is given in inches, it may produce an unequal variance for the vectors. It is always preferred to have unit variance while performing K-Means clustering to get accurate clusters. Thus, the data array has to pass to whiten() method before any other steps.
cluster.vq.whiten(input_array, check_finite)
Parameters:
- input_array : The array of data points to be normalized.
- check_finite : If set to true, checks whether the input matrix contains only finite numbers. If set to false, ignores checking.
cluster.vq.kmeans()
This vq module has two methods namely kmeans() and kmeans2().
The kmeans() method uses a threshold value which on becoming less than or equal to the change in distortion in the last iteration, the algorithm terminates. This method returns the centroids calculated and the mean value of the Euclidean distances between the observations and the centroids.
cluster.vq.kmeans(input_array, k, iterations, threshold, check_finite)
Parameters:
- input_array : The array of data points to be normalized.
- k : No.of.clusters (centroids)
- iterations : No.of.iterations to perform kmeans so that distortion is minimized. If k is specified it is ignored.
- threshold : An integer value which if becomes less than or equal to change in distortion in last iteration, the algorithm terminates.
- check_finite : If set to true, checks whether the input matrix contains only finite numbers. If set to false, ignores checking.
The kmeans2() method does not use the threshold value to check for convergence. It has more parameters that decide the method of initialization of centroids, a method to handle empty clusters, and validating whether the input matrices contain only finite numbers. This method returns centroids and the clusters to which the vector belongs.
cluster.vq.kmeans2(input_array, k, iterations, threshold, minit, missing, check_finite)
Parameters:
- input_array : The array of data points to be normalized.
- k : No.of.clusters (centroids)
- iterations : No.of.iterations to perform kmeans so that distortion is minimized. If k is specified it is ignored.
- threshold : An integer value which if becomes less than or equal to change in distortion in last iteration, the algorithm terminates.
- minit : A string which denotes the initialization method of the centroids. Possible values are ‘random’, ‘points’, ‘++’, ‘matrix’.
- missing : A string which denotes action upon empty clusters. Possible values are ‘warn’, ‘raise’.
- check_finite : If set to true, checks whether the input matrix contains only finite numbers. If set to false, ignores checking.
cluster.vq.vq()
This method maps the observations to appropriate centroids which are calculated by the kmeans() method. It requires the input matrices to be normalized. It takes the normalized inputs and generated code-book as input. It returns the index in the code-book to which the observation corresponds to and the distance between the observation and its code (centroid).
K-Means clustering with a 2D array data
Step 1: Import the required modules.
Python3
import numpy as np
from scipy.cluster.vq import whiten, kmeans, vq, kmeans2
|
Step 2: Import/generate data. Normalize the data.
Python3
data = np.array([[1, 3, 4, 5, 2],
[2, 3, 1, 6, 3],
[1, 5, 2, 3, 1],
[3, 4, 9, 2, 1]])
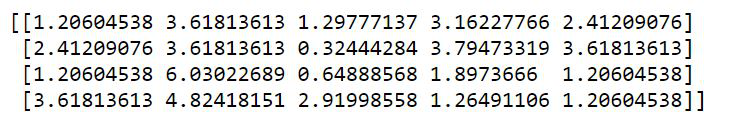
data = whiten(data)
print(data)
|
Output
Step 3: Calculate the centroids and generate the code book for mapping using kmeans() method
Python3
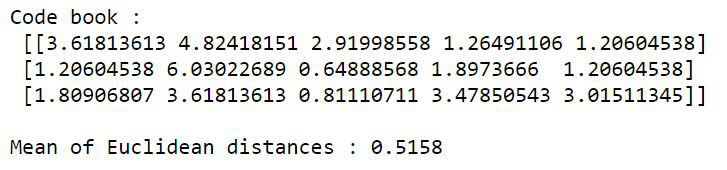
centroids, mean_value = kmeans(data, 3)
print("Code book :\n", centroids, "\n")
print("Mean of Euclidean distances :",
mean_value.round(4))
|
Output
Step 4: Map the centroids calculated in the previous step to the clusters.
Python3
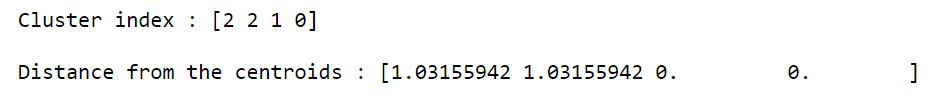
clusters, distances = vq(data, centroids)
print("Cluster index :", clusters, "\n")
print("Distance from the centroids :", distances)
|
Output
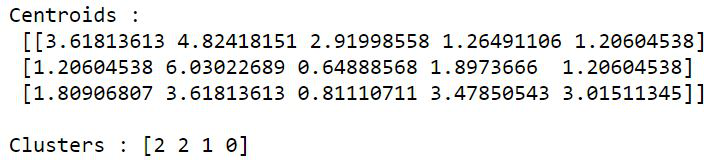
Consider the same example with kmeans2(). This does not require the additional step of calling vq() method. Repeat steps 1 and 2, then use the following snippet.
Python3
centroids, clusters = kmeans2(data, 3,
minit='random')
print("Centroids :\n", centroids, "\n")
print("Clusters :", clusters)
|
Output
Example 2: K-Means clustering of Diabetes dataset
The dataset contains the following attributes based on which a patient is either placed in diabetic cluster or non-diabetic cluster.
- Pregnancies
- Glucose
- Blood Pressure
- Skin Thickness
- Insulin
- BMI
- Diabetes Pedigree Function
- Age
Python3
import matplotlib.pyplot as plt
import numpy as np
from scipy.cluster.vq import whiten, kmeans, vq
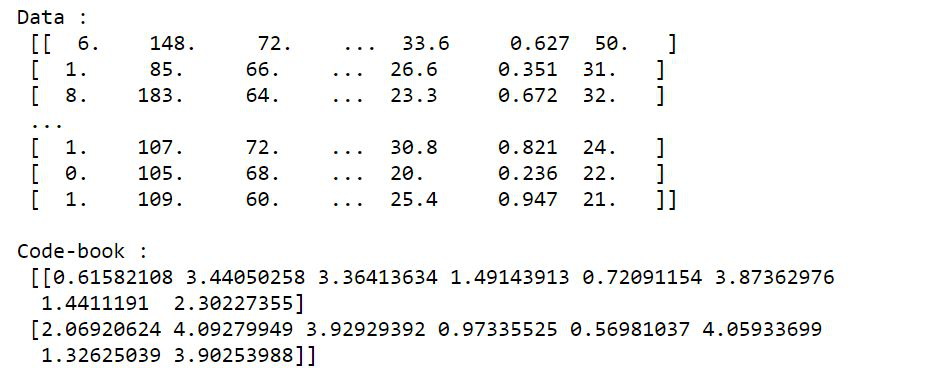
dataset = np.loadtxt(r"{your-path}\diabetes-train.csv",
delimiter=",")
dataset = dataset[:, 0:8]
print("Data :\n", dataset, "\n")
dataset = whiten(dataset)
centroids, mean_dist = kmeans(dataset, 2)
print("Code-book :\n", centroids, "\n")
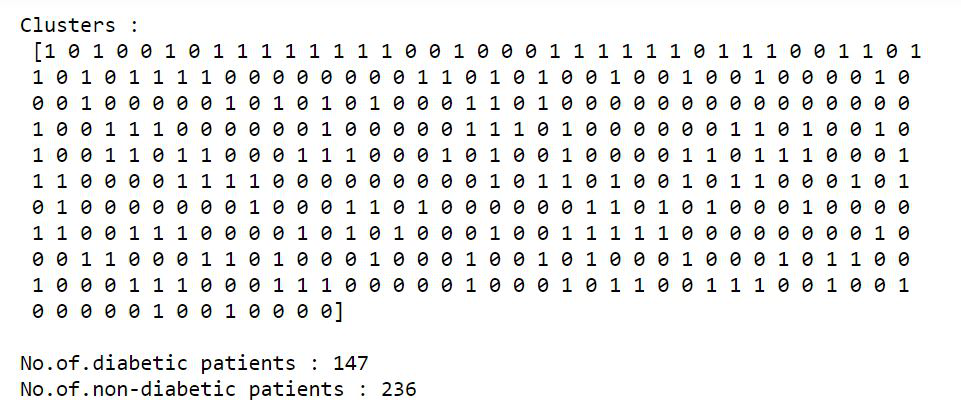
clusters, dist = vq(dataset, centroids)
print("Clusters :\n", clusters, "\n")
non_diab = list(clusters).count(0)
diab = list(clusters).count(1)
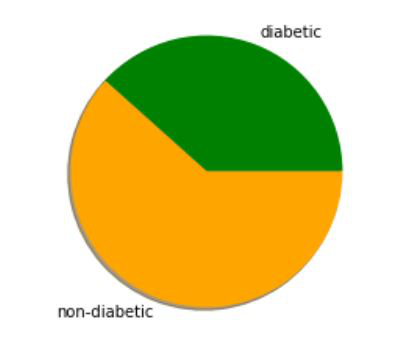
x_axis = []
x_axis.append(diab)
x_axis.append(non_diab)
colors = ['green', 'orange']
print("No.of.diabetic patients : " + str(x_axis[0]) +
"\nNo.of.non-diabetic patients : " + str(x_axis[1]))
y = ['diabetic', 'non-diabetic']
plt.pie(x_axis, labels=y, colors=colors, shadow='true')
plt.show()
|
Output
Like Article
Suggest improvement
Share your thoughts in the comments
Please Login to comment...