Introduction to tree diagram with R and ggraph
Last Updated :
20 Feb, 2022
In this article, we are going to see how to visualize the tree diagram with R Programming using ggraph library. ggraph library has a bunch of methods to help in visualization in R Programming Language.
Visualizing the Dendrogram
A dendrogram is a visual representation of the hierarchical relationship between items. It’s most often produced as a result of hierarchical clustering. A dendrogram’s main purpose is to figure out the best approach to assign objects to clusters.
Preparing the Hierarchical Data
Here we are going to prepare hierarchical data for demonstration. For this, we will create two dataframe, and then we will create edge data.
R
library(ggraph)
library(igraph)
library(tidyverse)
library(ggplot2)
d1 <- data.frame(from = "origin",
to = paste("group",
seq(1,5),
sep = ""))
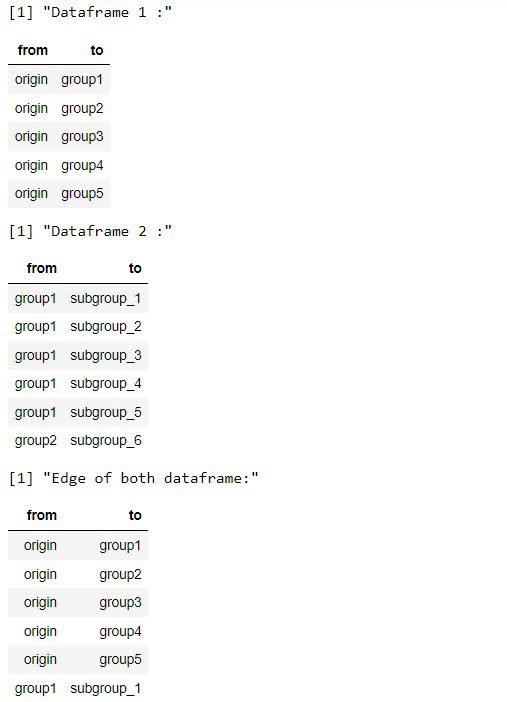
print("Dataframe 1 :")
head(d1)
d2 <- data.frame(from = rep(d1$to, each = 5),
to = paste("subgroup",
seq(1,25),
sep="_"))
print("Dataframe 2 :")
head(d2)
edges <- rbind(d1, d2)
print("Edge of both dataframe:")
head(edges)
|
Output:
Prepare the Graph Data
graph_from_data_frame() methods creates igraph graphs from one or two data frames and its descriptions have been obtained from the igraph package.
Syntax: graph_from_data_frame(d, directed = TRUE)
Parameters:
- d : Dataframe
- directed: Logical scalar
R
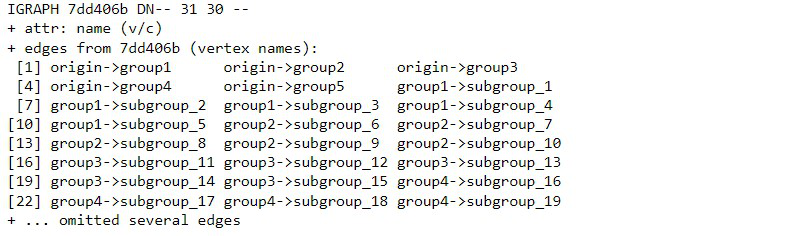
mygraph <- graph_from_data_frame( edges )
mygraph
|
Output:
Preparing the Dendrogram
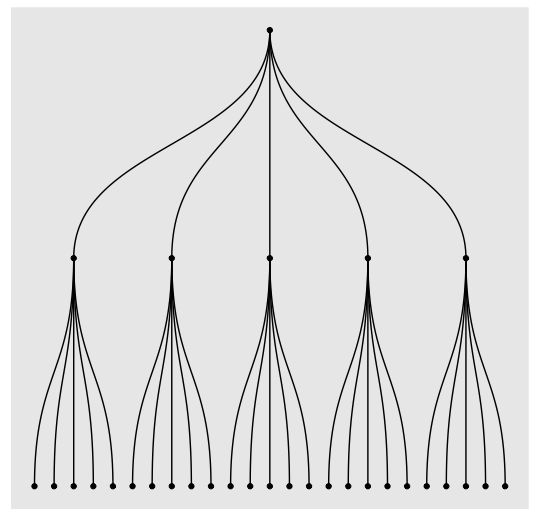
Now, we will plot dendrogram using ggraph library. For this, we will use dendrogram layout of ggraph with layout = ‘dendrogram’ and geom_edge_diagonal() is used to the edges and geom_node_point() for data points
Syntax: ggraph(graph, layout)
Parameters:
- graph: graph Object
- layout: Layout type instring, a function, a matrix, or a data.frame
R
ggraph(mygraph, layout = 'dendrogram') +
geom_edge_diagonal() +
geom_node_point()
|
Output:
Like Article
Suggest improvement
Share your thoughts in the comments
Please Login to comment...