Introduction to SAS programming
Last Updated :
30 Sep, 2022
Statistical Analysis System (SAS) is a software suite that has been developed by SAS Institute, one of the leaders in analytics. It is useful for performing advanced analytics, multivariate analyses, business intelligence, data management functions, and also for conducting predictive analytics.
Use of SAS:
SAS is used by many top organizations which include Google, Facebook, Twitter and Accenture for answering the many questions which persist at a business and organizational level and is also used for generating informative reports. It helps in business forecasting, quality improvement, operations research and project management. It is particularly useful in applications development and graphics design. This article should help you get an intuition about the working of SAS applications and a hint about it’s raw power.
Types of SAS software:
There are various types of SAS software that are available.In general there are 4 types of SAS software which are given below.
- SAS for Windows
- SAS EG (Enterprise Guide)
- SAS Enterprise Miner (EM)
- SAS Stat Software
The most used software among the above types is SAS for Windows. It can be easily deployed and allows for modernization of your SAS environment by enabling grid processing.
SAS Libraries:
Libraries are the storage mechanisms in SAS. It can store the programs which can be similar in nature. Broadly speaking there are 2 types of libraries viz. temporary and permanent. Temporary libraries are those that exist only during the current SAS session or job. Permanent libraries, as the name suggests are stored in the external storage and are not deleted at the end of a session.
SAS programming workflow:
SAS programming applications are characterized by the flow control specified in the below diagram. 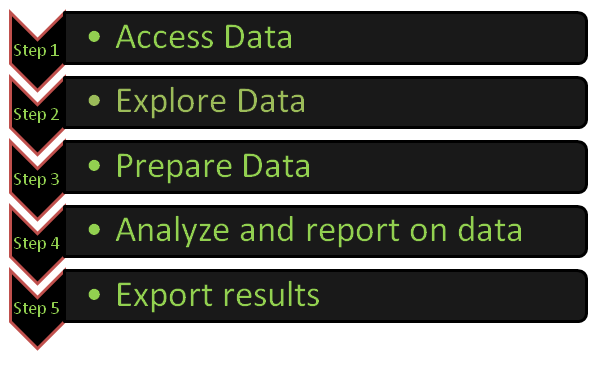
In the first phase of the above diagram a SAS program will read the data which is usually stored as worksheets in an Excel Workbook. A connection to the workbook is made in this phase and the data is imported in a format suitable for usage in the following phases.
Explore Data:
In the second phase we check for inconsistencies or incorrect values. Here frequency reports and summary statistics may also be generated. Looking at these reports and summaries at first glance we might find some inconsistencies right off the bat. For example all the label names of a categorical attribute except for one might be in capitalized letters. Another example of an incorrect value is a negative value for the minimum number of runs scored by a batsman during a string of matches. The first 5 rows are also shown in this phase.
Prepare Data:
In this phase the issues found in the earlier phase are fixed. Here we create new columns with existing values or concatenate them. Conditional processing is also done in this phase. Certain tables are also joined to provide more consistent representations of data. These tables have clean and validated values.
Analyze and Reporting on data and exporting the results:
The last two phases are combined into one in SAS programming applications. Here we create maps based on geographical coordinates, summary statistics etc. which are some of the output models used for displaying results. We can also save the output models created in an Excel Workbook and download it for later offline use.
Also, there are 200+ components present in SAS, Some popular components are:
- Base SAS
- SAS/GRAPH
- SAS/STAT
- SAS/INSIGHT
- SAS/PH
- SAS/ETS etc.
This is the overall framework of a SAS programming application. Hope this article helps you to get a clear view of the workflow of a SAS program.
Like Article
Suggest improvement
Share your thoughts in the comments
Please Login to comment...