Introduction to Graphs – Data Structure and Algorithm Tutorials
Last Updated :
16 Mar, 2023
Introduction:
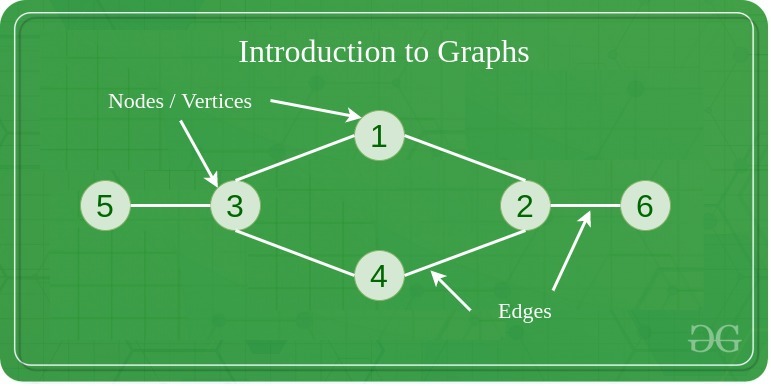
A Graph is a non-linear data structure consisting of vertices and edges. The vertices are sometimes also referred to as nodes and the edges are lines or arcs that connect any two nodes in the graph. More formally a Graph is composed of a set of vertices( V ) and a set of edges( E ). The graph is denoted by G(V, E).
Graph data structures are a powerful tool for representing and analyzing complex relationships between objects or entities. They are particularly useful in fields such as social network analysis, recommendation systems, and computer networks. In the field of sports data science, graph data structures can be used to analyze and understand the dynamics of team performance and player interactions on the field.
Imagine a game of football as a web of connections, where players are the nodes and their interactions on the field are the edges. This web of connections is exactly what a graph data structure represents, and it’s the key to unlocking insights into team performance and player dynamics in sports.
Components of a Graph
- Vertices: Vertices are the fundamental units of the graph. Sometimes, vertices are also known as vertex or nodes. Every node/vertex can be labeled or unlabelled.
- Edges: Edges are drawn or used to connect two nodes of the graph. It can be ordered pair of nodes in a directed graph. Edges can connect any two nodes in any possible way. There are no rules. Sometimes, edges are also known as arcs. Every edge can be labelled/unlabelled.
Types Of Graph
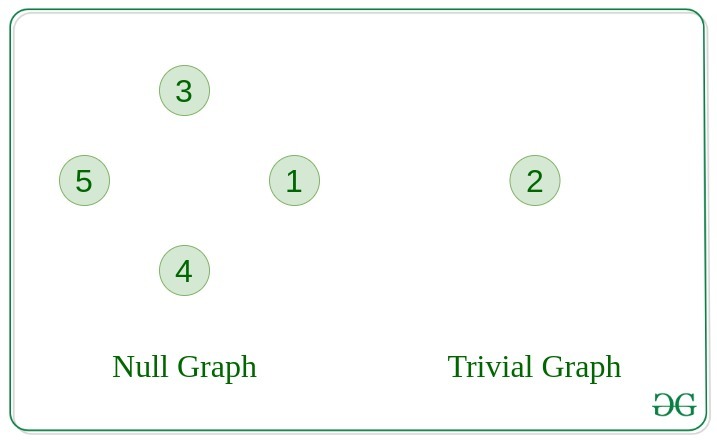
1. Null Graph
A graph is known as a null graph if there are no edges in the graph.
2. Trivial Graph
Graph having only a single vertex, it is also the smallest graph possible.
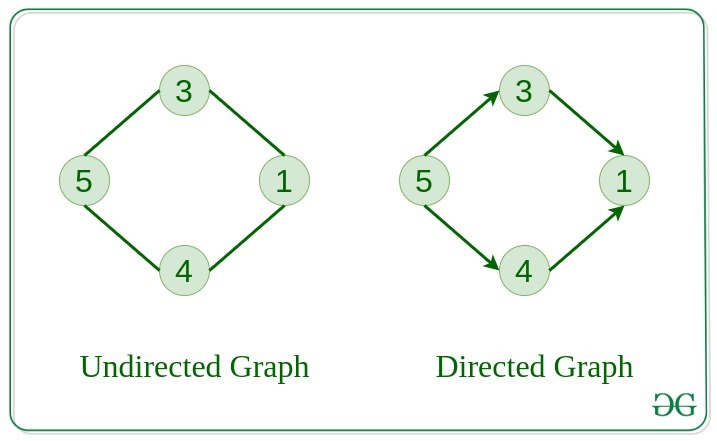
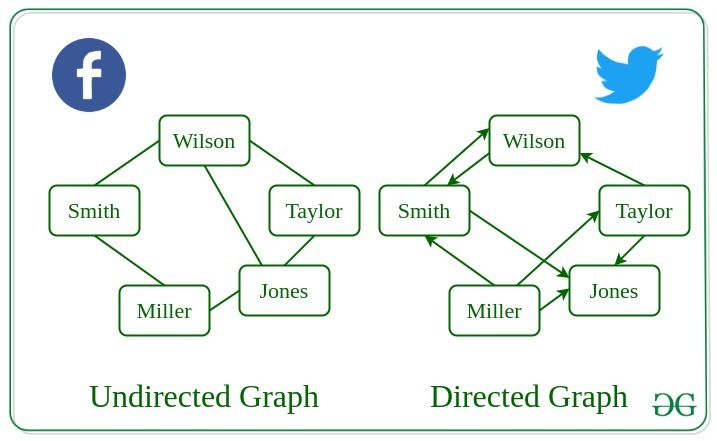
3. Undirected Graph
A graph in which edges do not have any direction. That is the nodes are unordered pairs in the definition of every edge.
4. Directed Graph
A graph in which edge has direction. That is the nodes are ordered pairs in the definition of every edge.
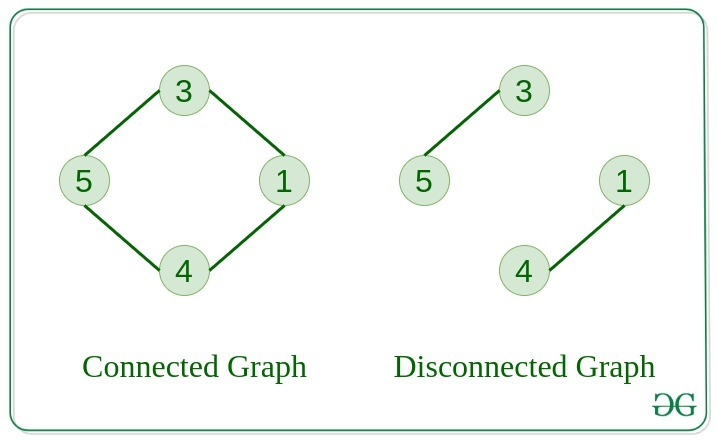
5. Connected Graph
The graph in which from one node we can visit any other node in the graph is known as a connected graph.
6. Disconnected Graph
The graph in which at least one node is not reachable from a node is known as a disconnected graph.
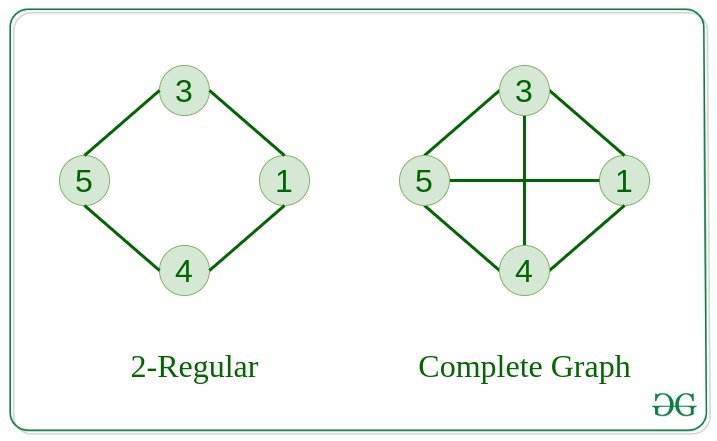
7. Regular Graph
The graph in which the degree of every vertex is equal to K is called K regular graph.
8. Complete Graph
The graph in which from each node there is an edge to each other node.
. 
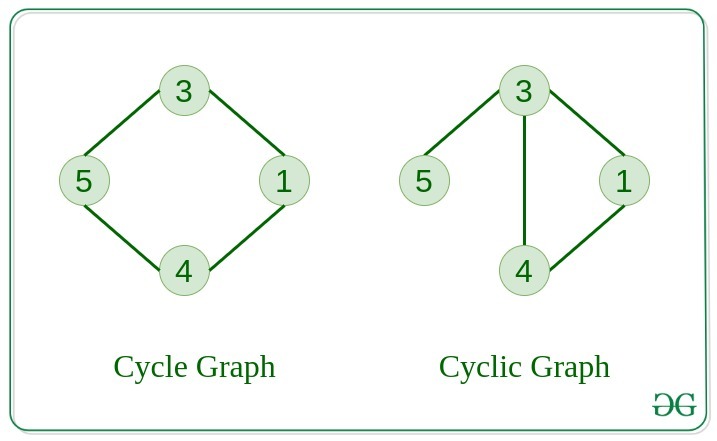
9. Cycle Graph
The graph in which the graph is a cycle in itself, the degree of each vertex is 2.
10. Cyclic Graph
A graph containing at least one cycle is known as a Cyclic graph.
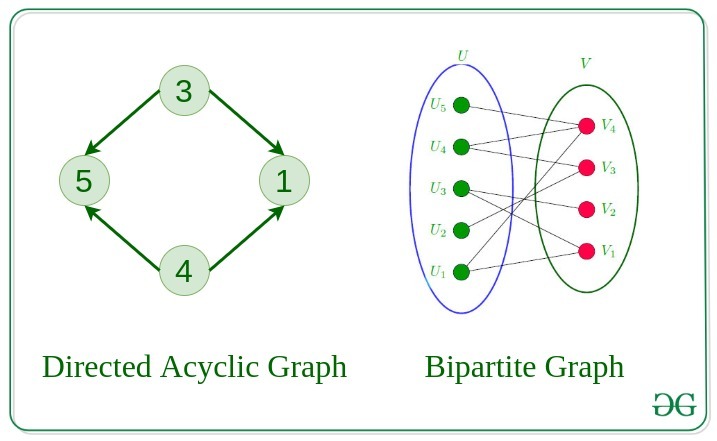
11. Directed Acyclic Graph
A Directed Graph that does not contain any cycle.
12. Bipartite Graph
A graph in which vertex can be divided into two sets such that vertex in each set does not contain any edge between them.
13. Weighted Graph
- A graph in which the edges are already specified with suitable weight is known as a weighted graph.
- Weighted graphs can be further classified as directed weighted graphs and undirected weighted graphs.
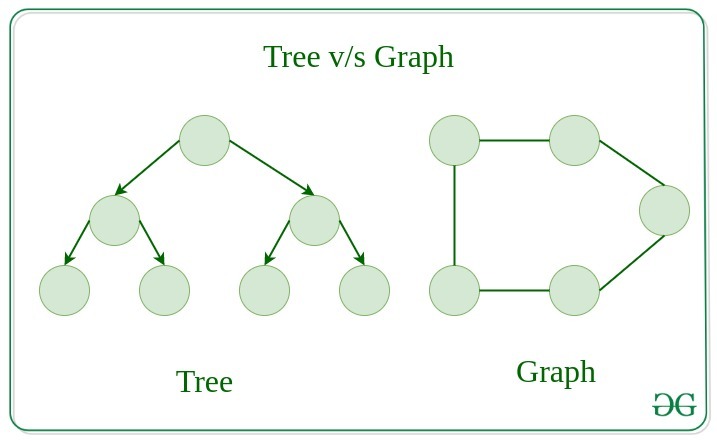
Tree v/s Graph
Trees are the restricted types of graphs, just with some more rules. Every tree will always be a graph but not all graphs will be trees. Linked List, Trees, and Heaps all are special cases of graphs.
Representation of Graphs
There are two ways to store a graph:
- Adjacency Matrix
- Adjacency List
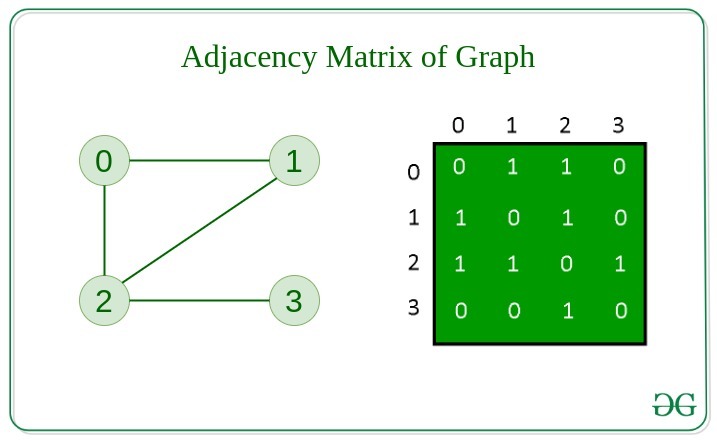
Adjacency Matrix
In this method, the graph is stored in the form of the 2D matrix where rows and columns denote vertices. Each entry in the matrix represents the weight of the edge between those vertices.
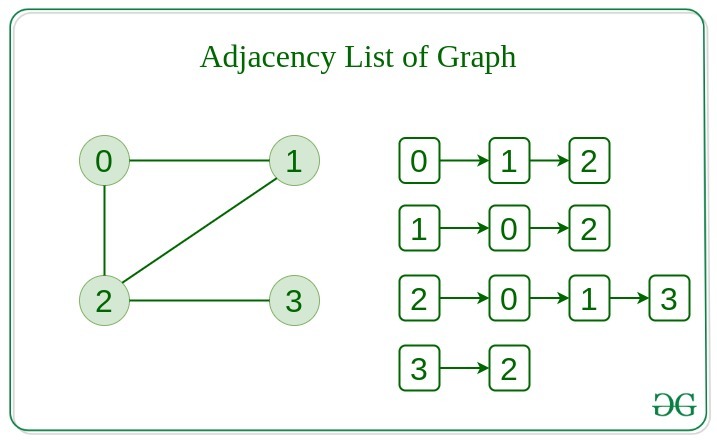
Adjacency List
This graph is represented as a collection of linked lists. There is an array of pointer which points to the edges connected to that vertex.
Comparison between Adjacency Matrix and Adjacency List
When the graph contains a large number of edges then it is good to store it as a matrix because only some entries in the matrix will be empty. An algorithm such as Prim’s and Dijkstra adjacency matrix is used to have less complexity.
| Action |
Adjacency Matrix |
Adjacency List |
| Adding Edge |
O(1) |
O(1) |
| Removing an edge |
O(1) |
O(N) |
| Initializing |
O(N*N) |
O(N) |
Basic Operations on Graphs
Below are the basic operations on the graph:
- Insertion of Nodes/Edges in the graph – Insert a node into the graph.
- Deletion of Nodes/Edges in the graph – Delete a node from the graph.
- Searching on Graphs – Search an entity in the graph.
- Traversal of Graphs – Traversing all the nodes in the graph.
Usage of graphs
- Maps can be represented using graphs and then can be used by computers to provide various services like the shortest path between two cities.
- When various tasks depend on each other then this situation can be represented using a Directed Acyclic graph and we can find the order in which tasks can be performed using topological sort.
- State Transition Diagram represents what can be the legal moves from current states. In-game of tic tac toe this can be used.
Real-Life Applications of Graph
Following are the real-life applications:
- Graph data structures can be used to represent the interactions between players on a team, such as passes, shots, and tackles. Analyzing these interactions can provide insights into team dynamics and areas for improvement.
- Commonly used to represent social networks, such as networks of friends on social media.
- Graphs can be used to represent the topology of computer networks, such as the connections between routers and switches.
- Graphs are used to represent the connections between different places in a transportation network, such as roads and airports.
- Neural Networks: Vertices represent neurons and edges represent the synapses between them. Neural networks are used to understand how our brain works and how connections change when we learn. The human brain has about 10^11 neurons and close to 10^15 synapses.
- Compilers: Graphs are used extensively in compilers. They can be used for type inference, for so-called data flow analysis, register allocation, and many other purposes. They are also used in specialized compilers, such as query optimization in database languages.
- Robot planning: Vertices represent states the robot can be in and the edges the possible transitions between the states. Such graph plans are used, for example, in planning paths for autonomous vehicles.
When to use Graphs:
- When you need to represent and analyze the relationships between different objects or entities.
- When you need to perform network analysis.
- When you need to identify key players, influencers or bottlenecks in a system.
- When you need to make predictions or recommendations.
- Modeling networks: Graphs are commonly used to model various types of networks, such as social networks, transportation networks, and computer networks. In these cases, vertices represent nodes in the network, and edges represent the connections between them.
- Finding paths: Graphs are often used in algorithms for finding paths between two vertices in a graph, such as shortest path algorithms. For example, graphs can be used to find the fastest route between two cities on a map or the most efficient way to travel between multiple destinations.
- Representing data relationships: Graphs can be used to represent relationships between data objects, such as in a database or data structure. In these cases, vertices represent data objects, and edges represent the relationships between them.
- Analyzing data: Graphs can be used to analyze and visualize complex data, such as in data clustering algorithms or machine learning models. In these cases, vertices represent data points, and edges represent the similarities or differences between them.
However, there are also some scenarios where using a graph may not be the best approach. For example, if the data being represented is very simple or structured, a graph may be overkill and a simpler data structure may suffice. Additionally, if the graph is very large or complex, it may be difficult or computationally expensive to analyze or traverse, which could make using a graph less desirable.
Advantages and Disadvantages:
Advantages:
- Graphs are a versatile data structure that can be used to represent a wide range of relationships and data structures.
- They can be used to model and solve a wide range of problems, including pathfinding, data clustering, network analysis, and machine learning.
- Graph algorithms are often very efficient and can be used to solve complex problems quickly and effectively.
- Graphs can be used to represent complex data structures in a simple and intuitive way, making them easier to understand and analyze.
Disadvantages:
- Graphs can be complex and difficult to understand, especially for people who are not familiar with graph theory or related algorithms.
- Creating and manipulating graphs can be computationally expensive, especially for very large or complex graphs.
- Graph algorithms can be difficult to design and implement correctly, and can be prone to bugs and errors.
- Graphs can be difficult to visualize and analyze, especially for very large or complex graphs, which can make it challenging to extract meaningful insights from the data.
Summary:
- Graph data structures are a powerful tool for representing and analyzing relationships between objects or entities.
- Graphs can be used to represent the interactions between different objects or entities, and then analyze these interactions to identify patterns, clusters, communities, key players, influencers, bottlenecks and anomalies.
- In sports data science, graph data structures can be used to analyze and understand the dynamics of team performance and player interactions on the field.
- They can be used in a variety of fields such as Sports, Social media, transportation, cybersecurity and many more.
More Resources of Graph
Like Article
Suggest improvement
Share your thoughts in the comments
Please Login to comment...