Introduction to emojifont package in R
Last Updated :
26 Apr, 2022
In this article, we will see how to use emojifont package in R. This package is designed to bring emoji font to R Programming Language.
We will have a look at how to search and print emoji using emojifont package.
Installation:
To install this package type the below command in the terminal.
install.packages(“emojifont”)
Emoji characters in R
Now we have emojifont package installed so we will import it using library(emojifont). To print emoji we will use emoji(“emojiname”) to search emoji we will use search_emoji(“name”), this will return all the related emoji and we will store it as a list and print using emoji().
R
library(emojifont)
emoji("joy")
list <- c(search_emoji("joy"))
emoji(list)
|
Output:

Emoji characters in R
Getting a random sample of emoji
To get random emoji we will be using sample_emoji(x) to get random emoji’s.
R
library(emojifont)
list = c(sample_emoji(10))
emoji(list)
|
Output:

random sample of emoji
Emoji in R plot
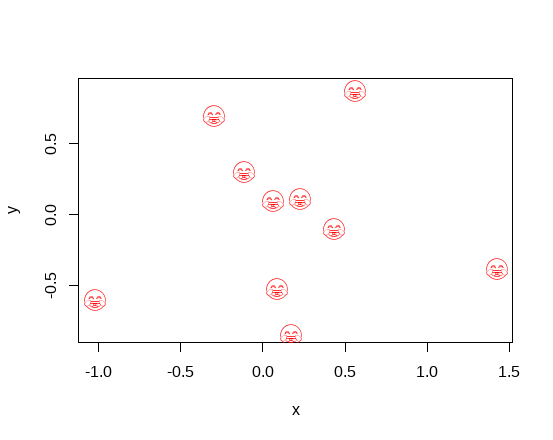
Method 1: Using Base Plot
plot() is used to plot the chart where x and y are coordinates.
plot(x, y, …)
“…” are the arguments passed to methods like graphicals parameters.
text() is used to draw vectors labels. where x,y coordinates,
text (x, y = NULL, labels = seq_along(x$x), cex = 1, col = NULL, …)
R
library(emojifont)
set.seed(200)
x <- rnorm(10)
set.seed(100)
y <- rnorm(10)
plot(x, y, cex = 0)
text(x, y, labels=emoji('joy'), cex=3.5, col='red',
family='EmojiOne')
|
Output:
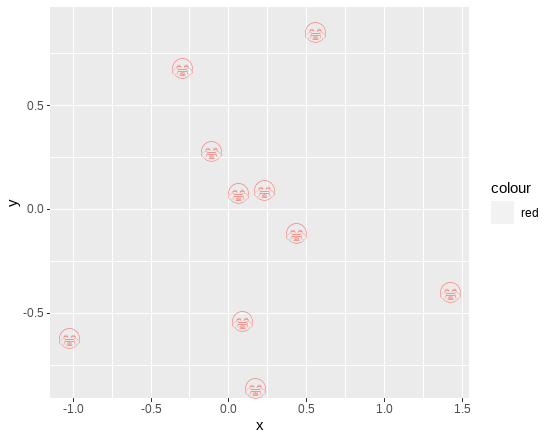
Method 2: Using ggplot
ggplot() is used to plot chart, where data is our data frame, aes() describes how content will be plotted on the screen.
ggplot(data = NULL, mapping = aes(), …)
R
library(emojifont)
library(ggplot2)
set.seed(200)
x <- rnorm(10)
set.seed(100)
y <- rnorm(10)
data <- data.frame(x=x,y=y)
ggplot(data,aes(x, y, color="red", label=emoji('joy'))) +
geom_text(family="EmojiOne", size=6)
|
Output:
Method 3: Using Geom_emoji
geom_emoji() works as a wrapper for visualizing emoji.
R
library(emojifont)
library(ggplot2)
ggplot() + geom_emoji("joy", color='red') + theme_void()
|
Output:

Method 4: Font Awesome
geom_fontawesome() works as a wrapper for visualizing fontawesome.
R
library(emojifont)
library(ggplot2)
ggplot() + geom_fontawesome("fa-desktop",
color='black') + theme_void()
|
Output:

Like Article
Suggest improvement
Share your thoughts in the comments
Please Login to comment...