Introduction to Bootstrap plot
Last Updated :
24 Jan, 2023
Before getting into Bootstrap plot, let us first understand what Bootstrapping (or Bootstrap sampling) is all about.
Bootstrap Sampling: It is a method in which we take a sample data repeatedly with replacement from a data set to estimate a population parameter. It is used to determine various parameters of a population.
A bootstrap plot is a graphical representation of the distribution of a statistic calculated from a sample of data. It is often used to visualize the variability and uncertainty of a statistic, such as the mean or standard deviation, by showing the distribution of the statistic over many bootstrapped samples of the data.
In a bootstrap plot, the x-axis represents the values of the statistic and the y-axis represents the frequency of those values. A line is plotted for each bootstrapped sample, with the height of the line indicating the frequency of the statistic’s value in that sample. The distribution of the lines represents the distribution of the statistic over the bootstrapped samples.
The bootstrap plot is a powerful tool for understanding the uncertainty in a statistic, especially when the underlying distribution of the data is unknown or complex. It can also be used to generate confidence intervals for a statistic and to compare the distributions of different statistics.
It is important to note that Bootstrap is a resampling technique which is used to estimate the uncertainty of a statistic from a sample, without making any assumptions about the underlying distribution of the data. It can be used to estimate standard errors, confidence intervals, and to perform hypothesis tests.
Bootstrap plot: It is a graphical method used to measure the uncertainty of any desired statistical characteristic of a population. It is an alternative to the confidence interval. (also a mathematical method used for calculation of a statistic).
Structure
- x-axis: Subsample number.
- y-axis: Computed value of the desired statistic for a given subsample.
Need for a Bootstrap plot:
Commonly, we can calculate the uncertainty of a statistic of a population mathematically, using confidence intervals. However, in many cases, the uncertainty formula that is derived is mathematically intractable. In such cases, we use the Bootstrap plot.
Suppose, we have 5000 people in a park, and we need to find the average weight of the whole population. It is not feasible to measure the weight of each individual and then take an average of that. This is where bootstrap sampling comes into the picture.
What we do is, we take groups of 5 people randomly from the population and find its mean. We do the same process say 8-10 times. This way, we get a good estimate of the average weight of the population more efficiently.
Intuition:
Let us consider an example and understanding how the Bootstrap plot makes it easier to obtain critical information from a large population. Say we have a sample data of 3000 randomly generated uniform numbers. We take out a sub-sample of 30 numbers and find its mean. We do this again for another random sub-sample and so on.
We plot a bootstrap plot of the above-acquired information and just by looking at it, we can easily give a good estimate about the mean of all the 3000 numbers. There is various other useful information one can get out of a bootstrap plot such as:
- which sub-sample had the lowest variance, or
- which sub-sample creates the narrowest confidence interval, etc.
Implementation:
Python
import pandas as pd
import numpy as np
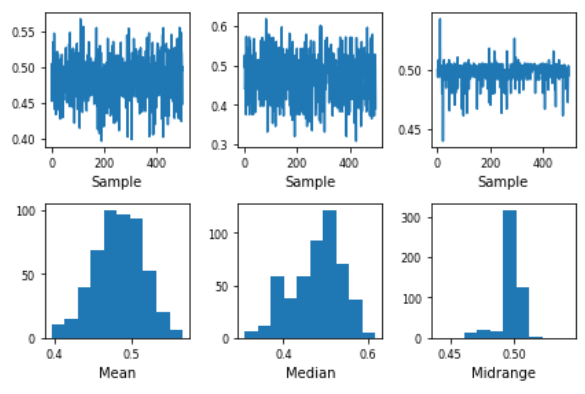
s = pd.Series(np.random.uniform(size=500))
pd.plotting.bootstrap_plot(s)
|
Output
Limitation
- The bootstrap plot gives an estimation of the required information from the population, not the exact values.
- It is highly dependent on the dataset given. It fails to give good results when a lot of subsets have repeated samples.
- The bootstrap plot becomes ineffective when we are obtaining information that is highly dependent on the tail values. [As shown in Fig 1]
Advantages of bootstrap:
- It is a non-parametric method, which means it does not require any assumptions about the underlying distribution of the data.
- It can be used to estimate standard errors and confidence intervals for a wide range of statistics.
- It can be used to estimate the uncertainty of a statistic even when the sample size is small.
- It can be used to perform hypothesis tests and compare the distributions of different statistics.
- It is widely used in many fields such as statistics, finance, and machine learning
Disadvantages of bootstrap:
- It can be computationally intensive, especially when working with large datasets.
- It may not be appropriate for all types of data, such as highly skewed or heavy-tailed distributions.
- It may not be appropriate for estimating the uncertainty of statistics that have very large variances.
- It may not be appropriate for estimating the uncertainty of statistics that are not smooth or have very different variances.
- It may not always be a good substitute for other statistical methods like asymptotic methods, when large sample sizes are available.
Like Article
Suggest improvement
Share your thoughts in the comments
Please Login to comment...