Introduction to Block Plot
Last Updated :
03 Feb, 2023
A block plot is similar to a box plot, showing the importance of a particular factor in the data. [As shown in Fig 1] Just like ANOVA, it is used to show statistical significance.
A block plot, also known as a block diagram or block chart, is a graphical representation of the relationship between different variables in a dataset. It is often used to visualize the distribution of a variable, such as the distribution of a continuous variable or the frequency of a categorical variable.
In a block plot, each block represents a group or category of the data, and the height of the block represents the frequency of that group or category. The blocks can be arranged vertically or horizontally and can be color-coded to indicate different subcategories or levels of the variable.
Block plots are useful for quickly understanding the distribution of a variable and identifying patterns or outliers in the data. They are often used in exploratory data analysis and can be used to compare the distribution of different variables or groups.
It is important to note that Block plots are often used in conjunction with other types of plots, such as histograms and box plots, to provide a more comprehensive view of the data.
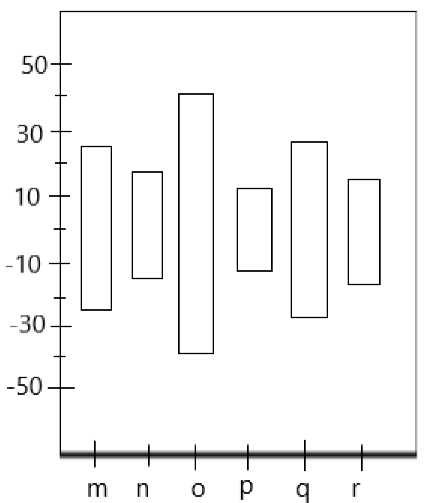
FIg.1: Block Plot
Structure of Block Plot:
The structure of block plot includes:
- X-axis — All combinations of secondary variables/features from m to r.
- Y-axis — Response variable y. (significance measure)
We can use it when: data is of an extremely non-normal distribution. (Unlike ANOVA, where the data had to be of a normal distribution)
Interpreting a Block Plot
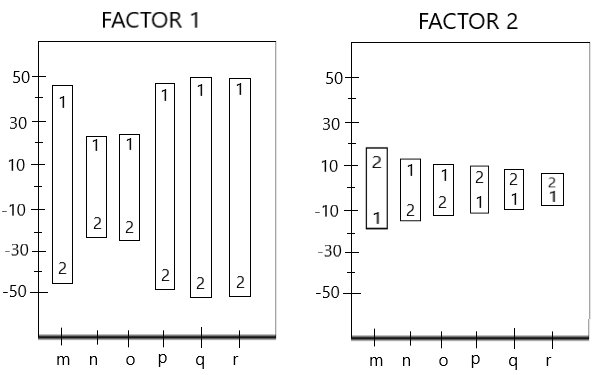
Fig 2: Interpreting results from a Block plot
In a block plot, we deal with levels. (the numbers 1 and 2 are levels as shown in Fig 2) We can notice the following observations:
Observation 1:
- If the levels of a block plot are uniform (i.e. all from 1->2 or 2->1), then that factor is significant to the data. [Block plot for Factor 1]
- If the levels of a block plot are non-uniform. (i.e some from 1->2 while some from 2->1), the factor under observation is not that significant. [Block plot for Factor 2]
Observation 2:
The height of the bar determines the impact of that factor on the response variable.
- The block plot for FACTOR 1 is consistently taller, hence it is of higher significance. (i.e. FACTOR 1 is important)
- The block plot for FACTOR 2 is comparatively lower, hence making it less significant. (i.e. FACTOR 2 is not that important)
Advantages of Block Plot:
- The first advantage is that we can replace ANOVA (Analysis of Variance), a quantitative procedure with Block plot. (A graphical procedure)
- The second advantage is that a block plot has a lot of lesser assumptions to meet, unlike the other statistical tests. (for eg. it works well even for non-normal distribution of data)
IMPORTANT POINTS:
A block plot, also known as a block diagram or block chart, is a graphical representation of the relationship between different variables in a dataset.
It is often used to visualize the distribution of a variable, such as the distribution of a continuous variable or the frequency of a categorical variable.
In a block plot, each block represents a group or category of the data, and the height of the block represents the frequency of that group or category.
Blocks can be arranged vertically or horizontally and can be color-coded to indicate different subcategories or levels of the variable.
Block plots are useful for quickly understanding the distribution of a variable and identifying patterns or outliers in the data.
They are often used in exploratory data analysis and can be used to compare the distribution of different variables or groups.
They are often used in conjunction with other types of plots, such as histograms and box plots, to provide a more comprehensive view of the data.
It is also important to note that the scale of the y-axis should be chosen carefully, to ensure that the blocks are easily visible and distinguishable.
A block plot is a powerful graphical technique that focuses on whether the factor is significant or not as well as answers a variety of important questions like how much the process has improved and shows a comparative analysis of the impact of various factors on that process. For any doubt/query, comment below.
Like Article
Suggest improvement
Share your thoughts in the comments
Please Login to comment...