Implementing Rich getting Richer phenomenon using Barabasi Albert Model in Python
Last Updated :
01 Oct, 2020
Prerequisite- Introduction to Social Networks, Barabasi Albert Graph
In social networks, there is a phenomenon called Rich getting Richer also known as Preferential Attachment. In Preferential Attachment, a person who is already rich gets more and more and a person who is having less gets less. This is called the Rich getting Richer phenomena or Preferential Attachment.
For example, assume there are some students in a class and every student is friends with some students which is called its degree i.e a degree of a student Is the number of friends it has. Now the student with a higher degree is rich and the student with a low degree is poor. Now suppose there comes a new student in the class and he/she has to make m friends, so he/she will select students with a higher degree and become friends with them which increases the degree of rich. This is called Rich getting Richer or Preferential Attachment.
Barabasi Albert Model is the implementation of Preferential Attachment.
Logic – Below are the logic behind the Barabasi Albert Model:
- Take a random graph with n0 nodes and connect them randomly with a condition that each has at least 1 link.
- At each time we add a new node n which is less or equal to n0 links that will connect the new node to n nodes already in the network.
- Now the probability that a node connects to a particular node will depend on its degree. (Preferential Attachment).
Approach – Below are the steps for implementing the Barabasi Albert Model:
- Take a graph with n nodes.
- Take m from the user i.e number of edges to be connected to the new node.
- Take m0 i.e initial number of nodes such that m<=m0.
- Now add the n-m0 nodes.
- Now add edges to these n-m0 nodes according to Preferential Attachment.
Below is the implementation of the Barabasi Albert model.
Python3
import networkx as nx
import random
import matplotlib.pyplot as plt
def display(g, i, ne):
pos = nx.circular_layout(g)
if i == '' and ne == '':
new_node = []
rest_nodes = g.nodes()
new_edges = []
rest_edges = g.edges()
else:
new_node = [i]
rest_nodes = list(set(g.nodes()) - set(new_node))
new_edges = ne
rest_edges = list(set(g.edges()) - set(new_edges) - set([(b, a) for (a, b) in new_edges]))
nx.draw_networkx_nodes(g, pos, nodelist=new_node, node_color='g')
nx.draw_networkx_nodes(g, pos, nodelist=rest_nodes, node_color='r')
nx.draw_networkx_edges(g, pos, edgelist=new_edges, style='dashdot')
nx.draw_networkx_edges(g, pos, edgelist=rest_edges,)
plt.show()
def barabasi_add_nodes(g, n, m0):
m = m0 - 1
for i in range(m0 + 1, n + 1):
g.add_node(i)
degrees = nx.degree(g)
node_prob = {}
s = 0
for j in degrees:
s += j[1]
print(g.nodes())
for each in g.nodes():
node_prob[each] = (float)(degrees[each]) / s
node_probabilities_cum = []
prev = 0
for n, p in node_prob.items():
temp = [n, prev + p]
node_probabilities_cum.append(temp)
prev += p
new_edges = []
num_edges_added = 0
target_nodes = []
while (num_edges_added < m):
prev_cum = 0
r = random.random()
k = 0
while (not (r > prev_cum and r <= node_probabilities_cum[k][1])):
prev_cum = node_probabilities_cum[k][1]
k = k + 1
target_node = node_probabilities_cum[k][0]
if target_node in target_nodes:
continue
else:
target_nodes.append(target_node)
g.add_edge(i, target_node)
num_edges_added += 1
new_edges.append((i, target_node))
print(num_edges_added, ' edges added')
display(g, i, new_edges)
return g
def plot_deg_dist(g):
all_degrees = []
for i in nx.degree(g):
all_degrees.append(i[1])
unique_degrees = list(set(all_degrees))
unique_degrees.sort()
count_of_degrees = []
for i in unique_degrees:
c = all_degrees.count(i)
count_of_degrees.append(c)
print(unique_degrees)
print(count_of_degrees)
plt.plot(unique_degrees, count_of_degrees, 'ro-')
plt.xlabel('Degrees')
plt.ylabel('Number of Nodes')
plt.title('Degree Distribution')
plt.show()
N = 10
m0 = random.randint(2, N / 5)
g = nx.path_graph(m0)
display(g, '', '')
g = barabasi_add_nodes(g, N, m0)
plot_deg_dist(g)
|
Output:
Enter the value of n: 10
3
[0, 1, 3]
1  edges added
[0, 1, 3, 4]
1  edges added
[0, 1, 3, 4, 5]
1  edges added
[0, 1, 3, 4, 5, 6]
1  edges added
[0, 1, 3, 4, 5, 6, 7]
1  edges added
[0, 1, 3, 4, 5, 6, 7, 8]
1  edges added
[0, 1, 3, 4, 5, 6, 7, 8, 9]
1  edges added
[0, 1, 3, 4, 5, 6, 7, 8, 9, 10]
1  edges added
[1, 2, 3, 6]
[7, 1, 1, 1]
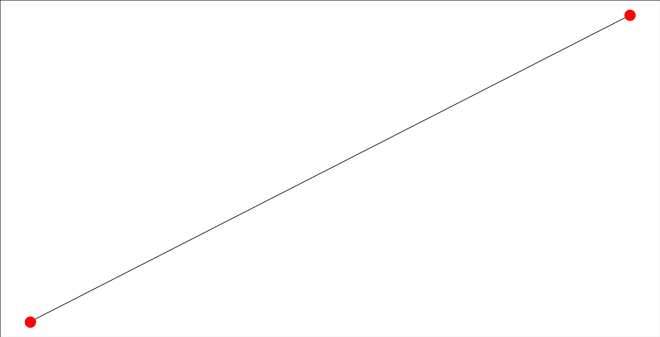
Initial Graph with m0 nodes
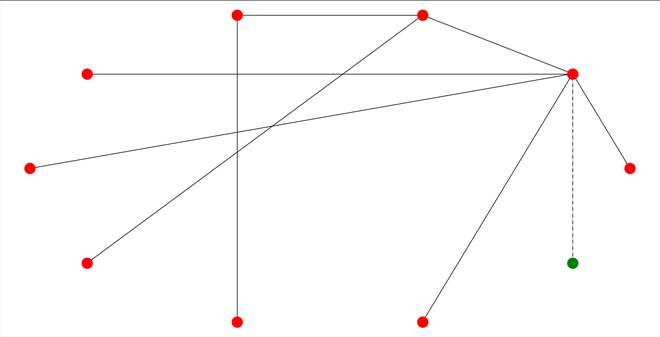
Final Node with new node added
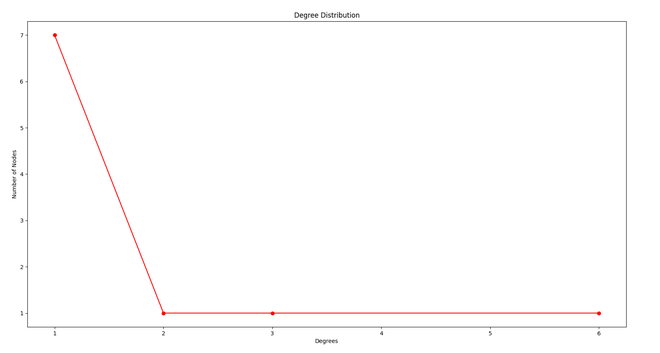
Distribution Graph
Like Article
Suggest improvement
Share your thoughts in the comments
Please Login to comment...