Image Reconstruction using Singular Value Decomposition (SVD) in Python
Last Updated :
03 Jan, 2023
Singular Value Decomposition aka SVD is one of many matrix decomposition Technique that decomposes a matrix into 3 sub-matrices namely U, S, V where U is the left eigenvector, S is a diagonal matrix of singular values and V is called the right eigenvector. We can reconstruct SVD of an image by using linalg.svd() method of NumPy module.
Syntax:
linalg.svd(matrix, full_matrices=True, compute_uv=True, hermitian=False)
Parameters:
- matrix : A real or complex matrix of size > 2.
- full_matrices: If True the size of u and v matrices are m x n , if False then the shape of u and v matrices are m x k , where k is non-zero values only.
- compute_uv: Takes in boolean value to compute u and v matrices along with s matrix.
- hermitian: By default matrix is assumed to be Hermitian if it contains real-values, this is used internally for efficiently computing the singular values.
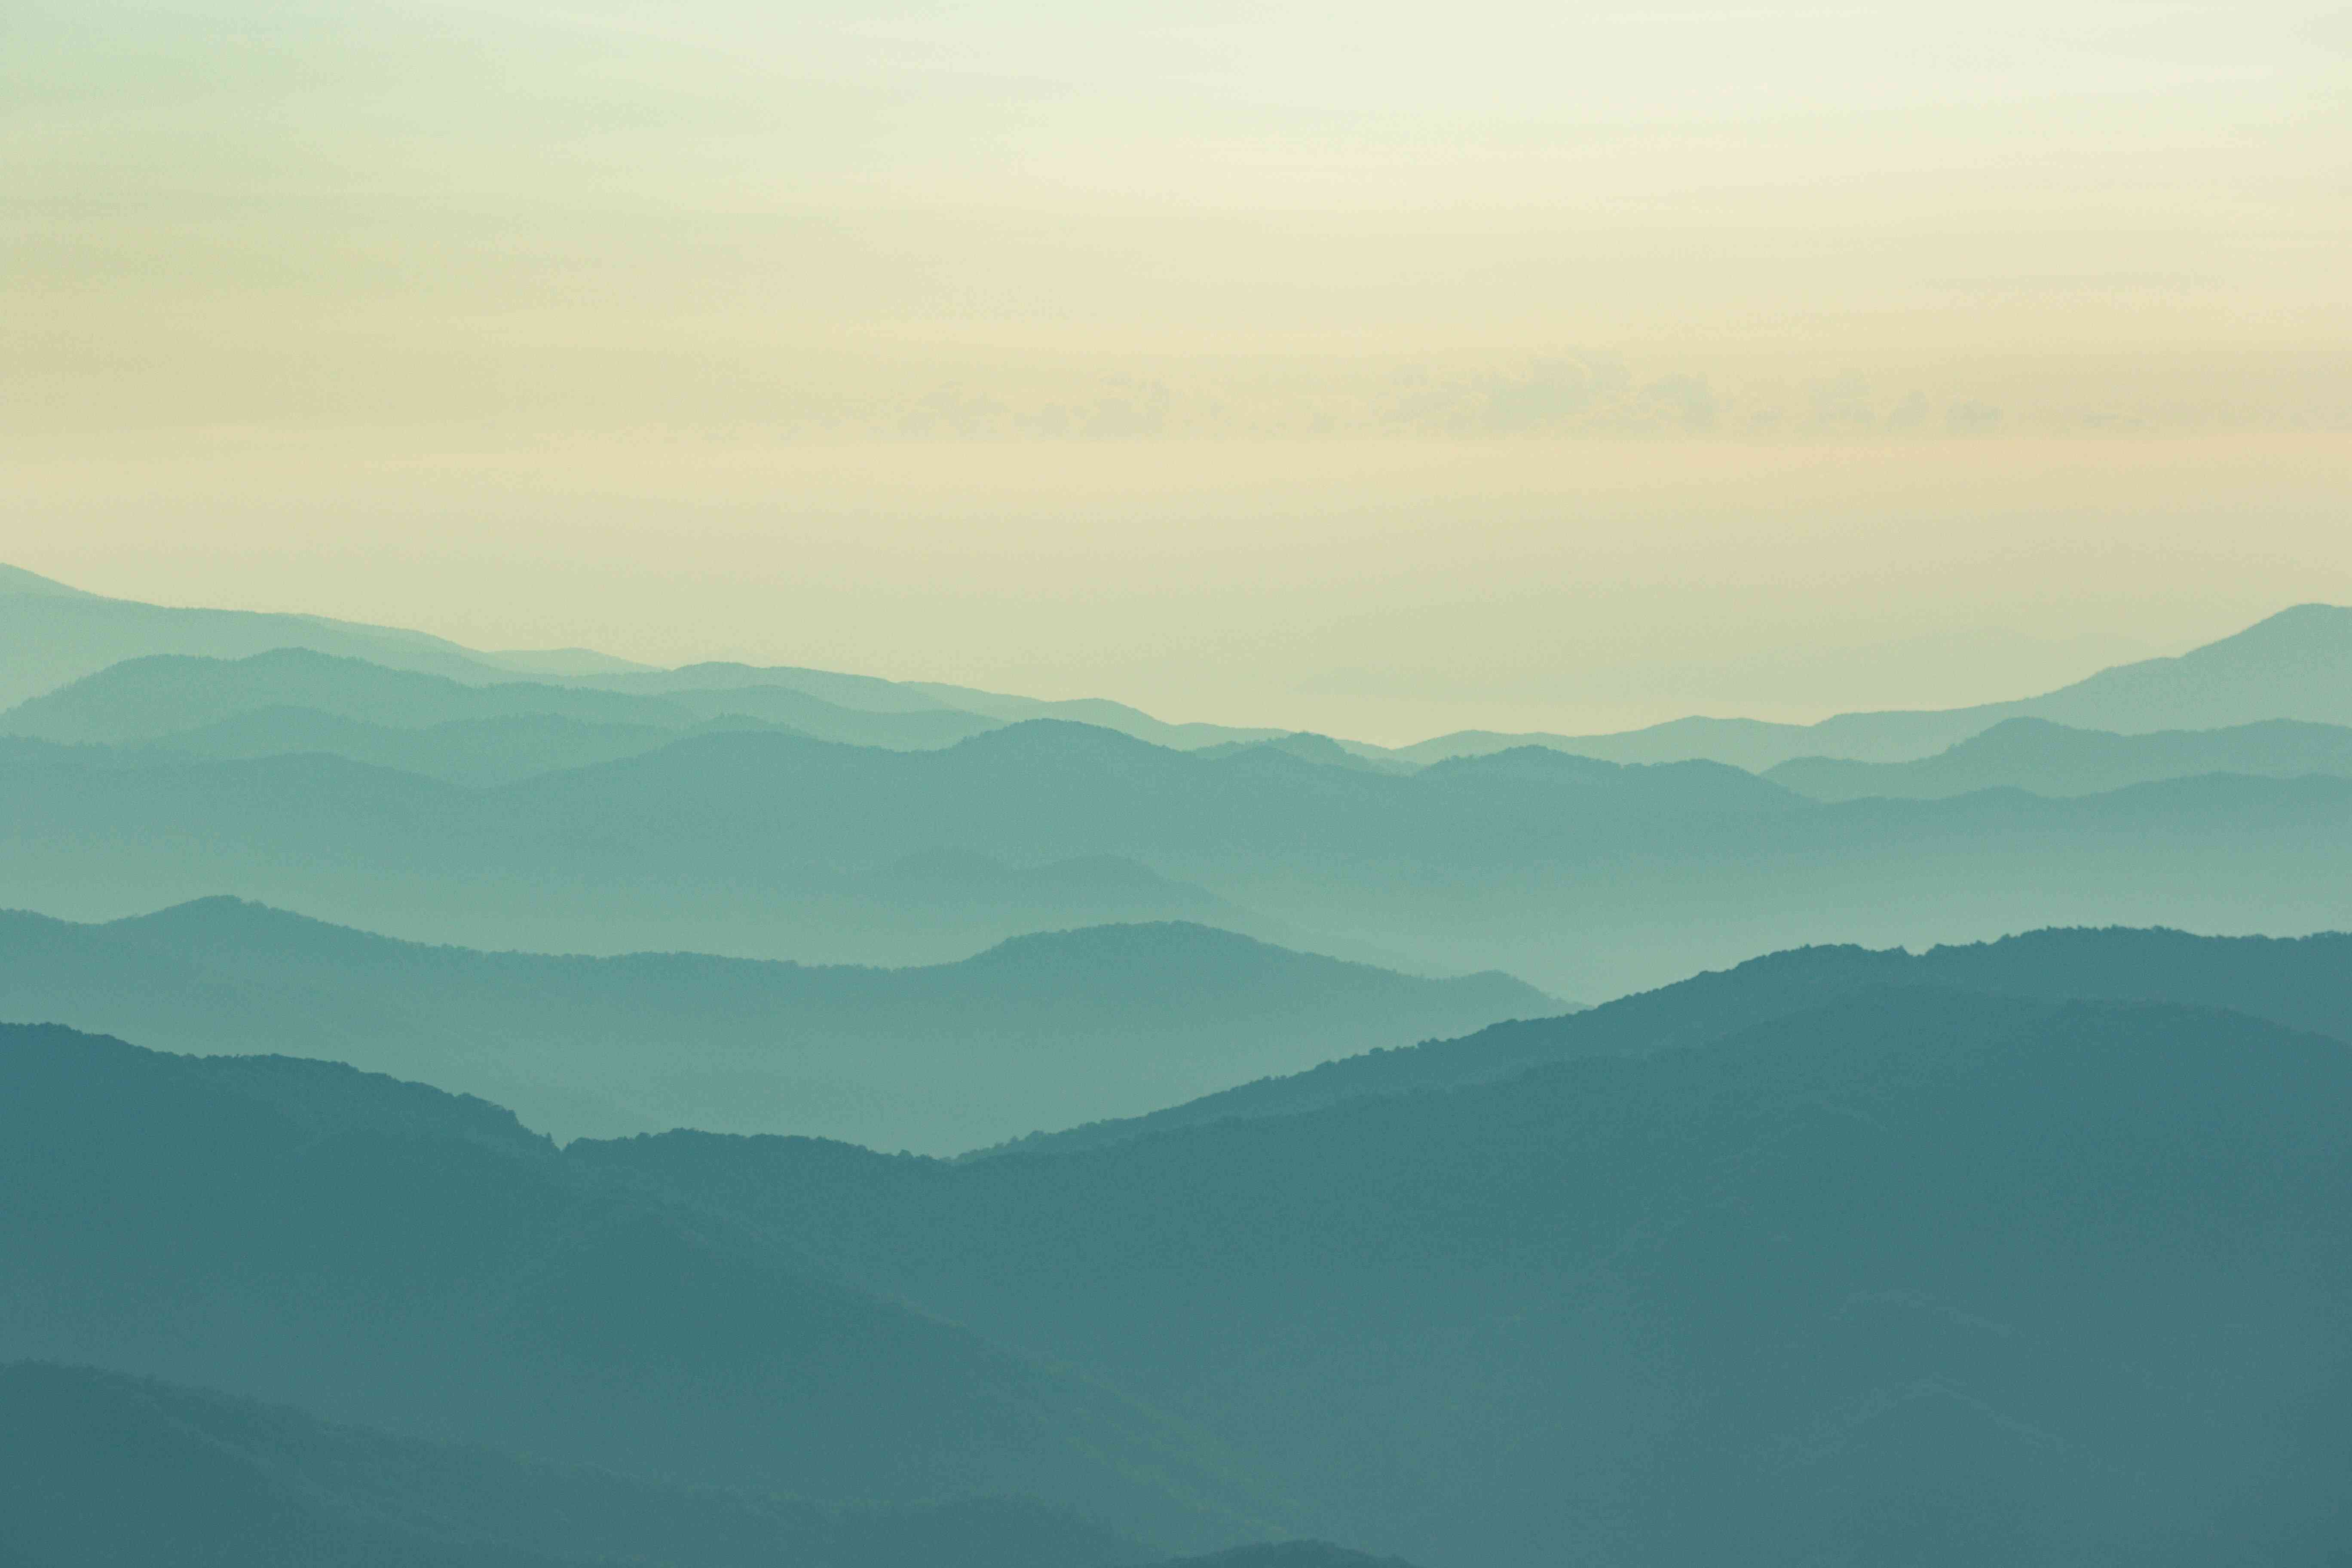
Image Used:
Python3
import requests
import cv2
import numpy as np
import matplotlib.pyplot as plt
response = requests.get(url, stream=True)
with open('image.png', 'wb') as f:
f.write(response.content)
img = cv2.imread('image.png')
gray_image = cv2.cvtColor(img, cv2.COLOR_BGR2GRAY)
u, s, v = np.linalg.svd(gray_image, full_matrices=False)
print(f'u.shape:{u.shape},s.shape:{s.shape},v.shape:{v.shape}')
|
Output:
u.shape:(3648, 3648),s.shape:(3648,),v.shape:(3648, 5472)
Explanation:
The above output shape indicates that there are 3648 linearly independent eigenvectors in this image.
Now let us look at the variance of the image used over a singular vector graphically:
Python3
import seaborn as sns
var_explained = np.round(s**2/np.sum(s**2), decimals=6)
print(f'variance Explained by Top 20 singular values:\n{var_explained[0:20]}')
sns.barplot(x=list(range(1, 21)),
y=var_explained[0:20], color="dodgerblue")
plt.title('Variance Explained Graph')
plt.xlabel('Singular Vector', fontsize=16)
plt.ylabel('Variance Explained', fontsize=16)
plt.tight_layout()
plt.show()
|
Output:
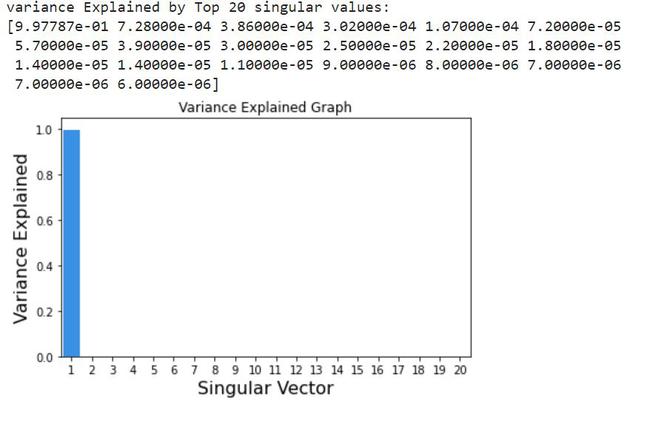
Variance Explained Graph.
Explanation: The Variance Explained Graph above clearly shows that about 99.77 % of information is explained by the first eigenvector and its corresponding eigenvalues themselves. Therefore, it very much advisable to reconstruct the image with just the top few eigenvectors themselves.
In the below program based on the above discussion, we reconstruct the image using SVD:
Python3
comps = [3648, 1, 5, 10, 15, 20]
plt.figure(figsize=(12, 6))
for i in range(len(comps)):
low_rank = u[:, :comps[i]] @ np.diag(s[:comps[i]]) @ v[:comps[i], :]
if(i == 0):
plt.subplot(2, 3, i+1),
plt.imshow(low_rank, cmap='gray'),
plt.title(f'Actual Image with n_components = {comps[i]}')
else:
plt.subplot(2, 3, i+1),
plt.imshow(low_rank, cmap='gray'),
plt.title(f'n_components = {comps[i]}')
|
Output:
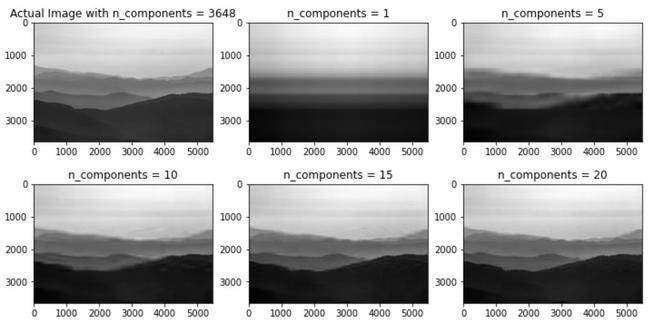
Image Reconstructed using SVD.
Explanation:
- Though the 1st eigenvector contains 99.77% of information reconstructing an image solely from it does not give a clear picture.
- Using the top 15 vectors for the image reconstruction gives a good enough approximation. Also out of 3648 vectors which is a massive decrease in computation and also it compresses the image.
Like Article
Suggest improvement
Share your thoughts in the comments
Please Login to comment...