Hypergeometric Distribution in R Programming
Last Updated :
10 Jul, 2020
Hypergeometric Distribution in R Language is defined as a method that is used to calculate probabilities when sampling without replacement is to be done in order to get the density value.
In R, there are 4 built-in functions to generate Hypergeometric Distribution:
- dhyper()
dhyper(x, m, n, k)
- phyper()
phyper(x, m, n, k)
- qhyper()
qhyper(x, m, n, k)
- rhyper()
rhyper(N, m, n, k)
where,
x: represents the data set of values
m: size of the population
n: number of samples drawn
k: number of items in the population
N: hypergeometrically distributed values
Functions To Generate Hypergeometric Distribution
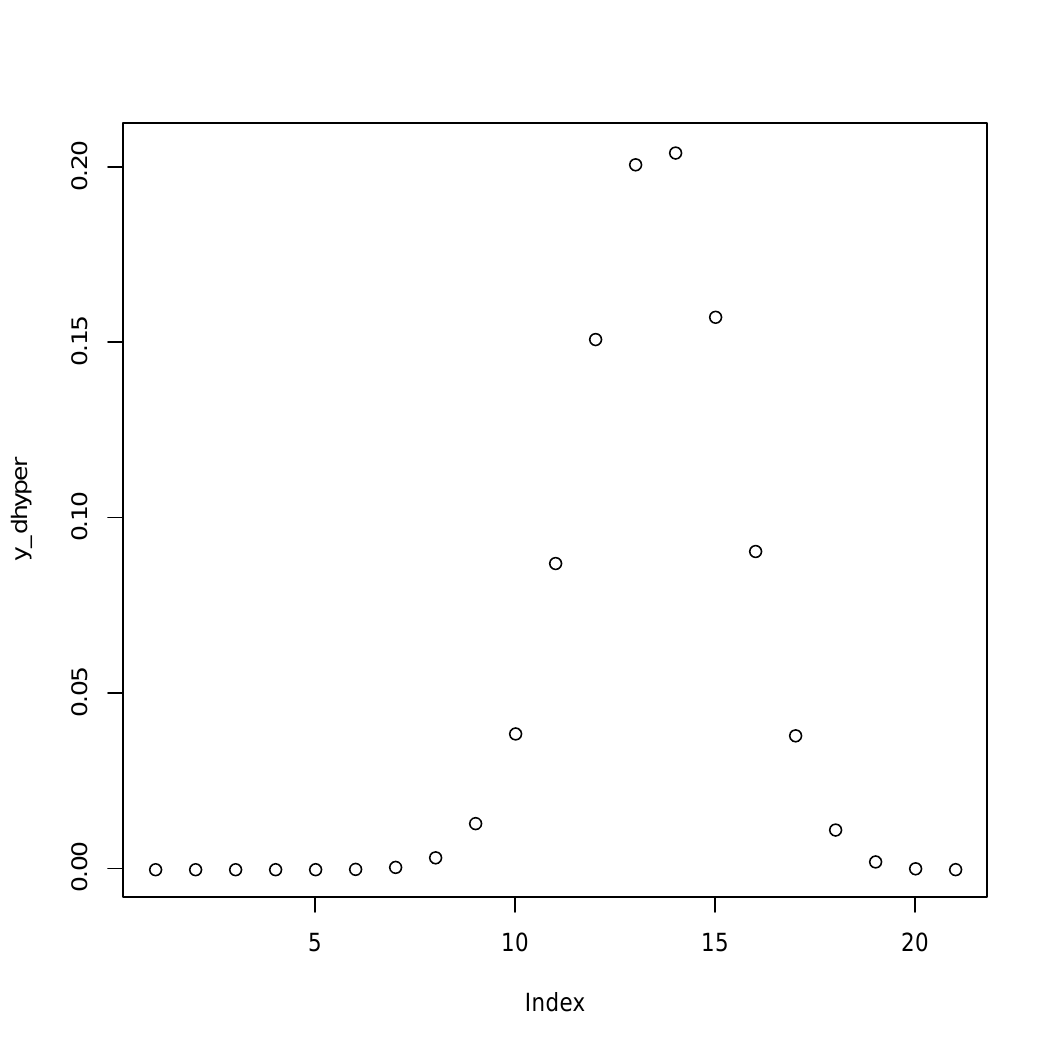
dhyper() Function
It is defined as Hypergeometric Density Distribution used in order to get the density value.
Syntax:
dhyper(x_dhyper, m, n, k)
Example 1:
x_dhyper <- seq(0, 22, by = 1.2)
y_dhyper <- dhyper(x_dhyper, m = 45, n = 30, k = 20)
plot(y_dhyper)
|
Output:
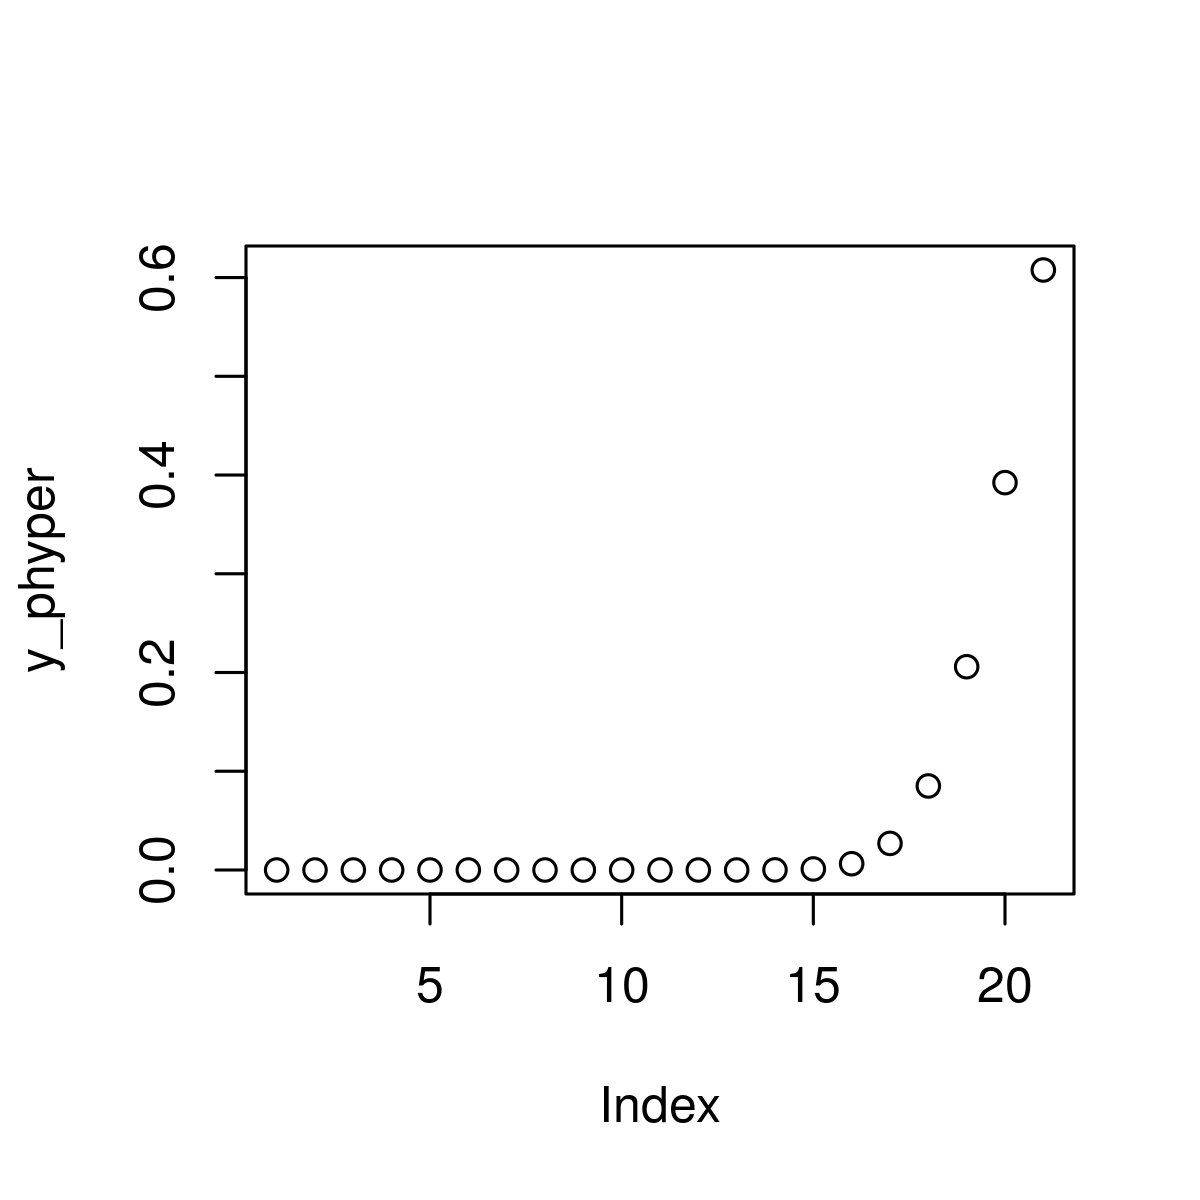
phyper() Function
Hypergeometric Cumulative Distribution Function used estimating the number of faults initially resident in a program at the beginning of the test or debugging process based on the hypergeometric distribution and calculate each value in x using the corresponding values.
Syntax:
phyper(x, m, n, k)
Example 1:
x_phyper <- seq(0, 22, by = 1)
y_phyper <- phyper(x_phyper, m = 40, n = 20, k = 31)
plot(y_phyper)
|
Output:
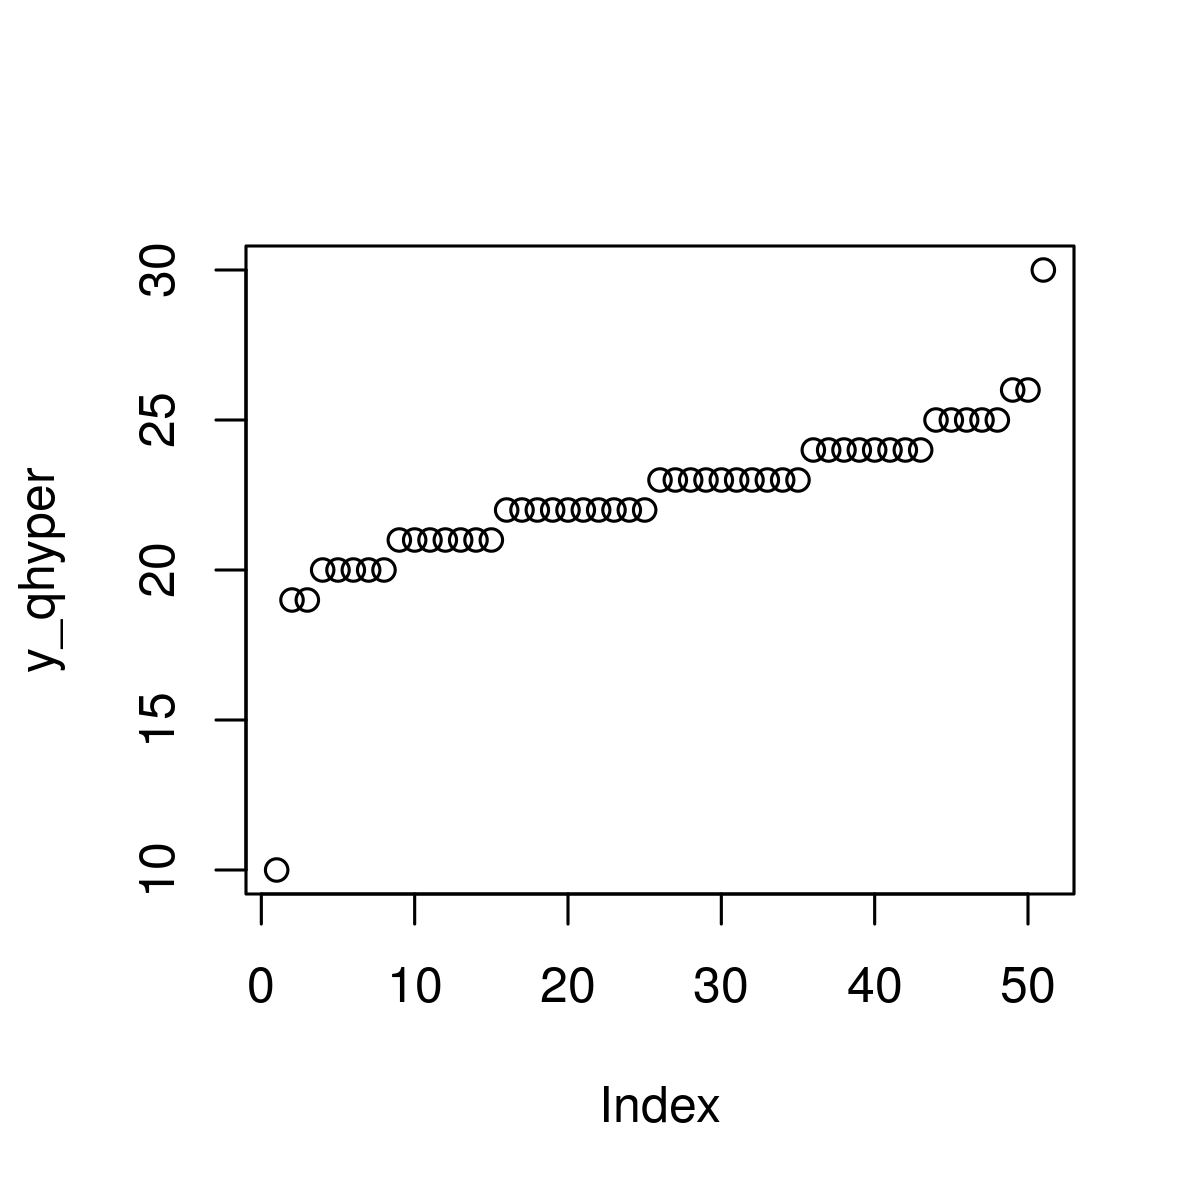
qhyper() Function
It is basically Hypergeometric Quantile Function used to specify a sequence of probabilities between 0 and 1.
Syntax:
qhyper(x, m, n, k)
Example 1:
x_qhyper <- seq(0, 1, by = 0.02)
y_qhyper <- qhyper(x_qhyper, m = 49, n = 18, k = 30)
plot(y_qhyper)
|
Output:
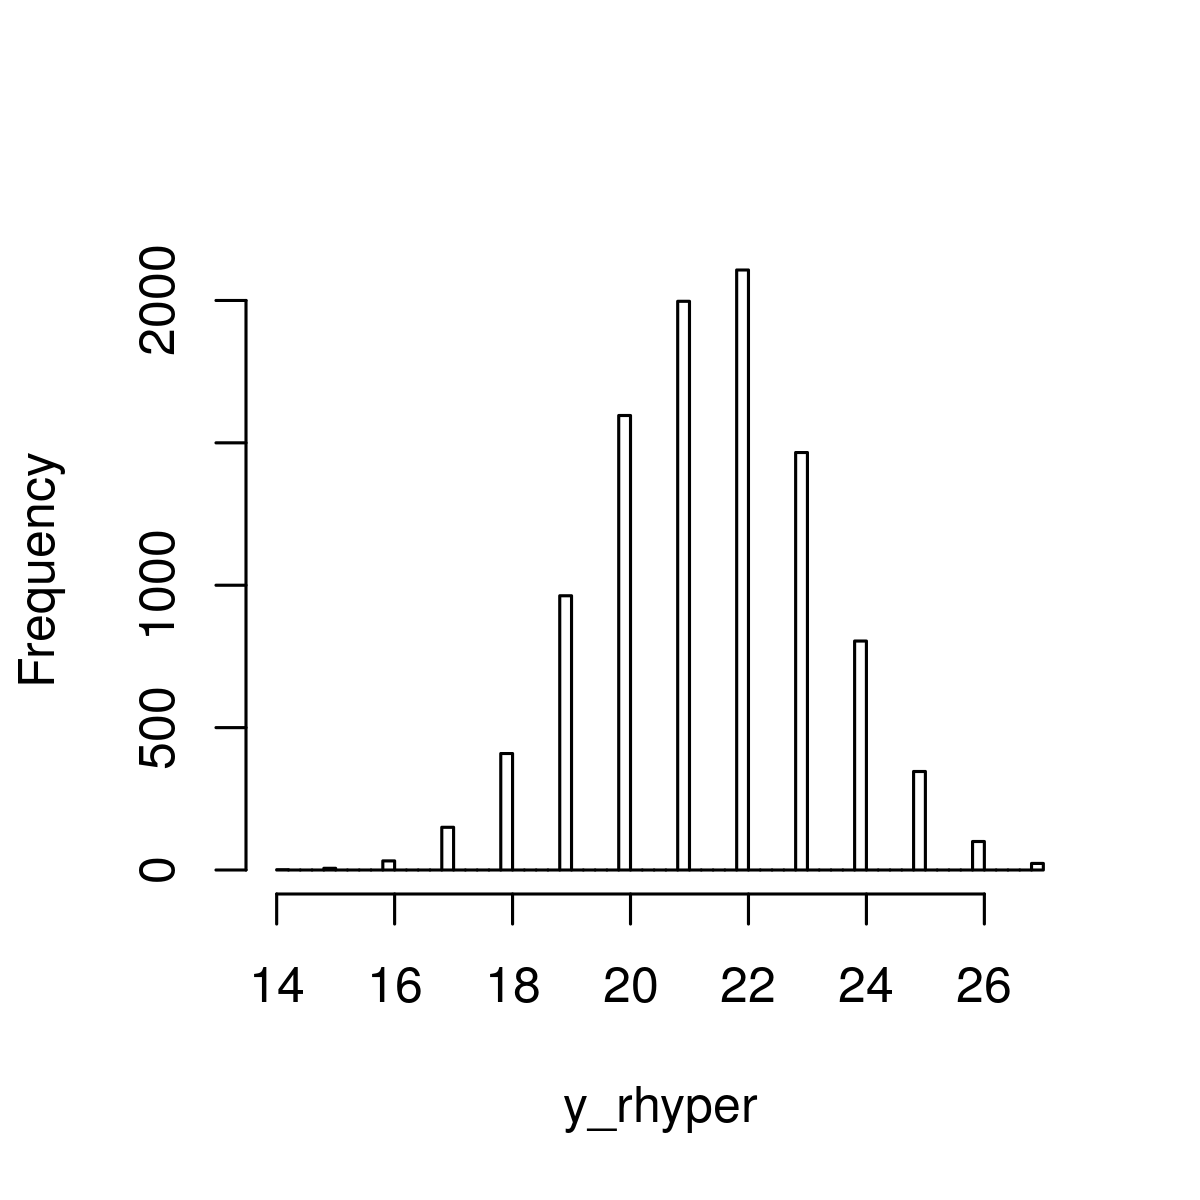
rhyper() Function
It generally refers to generating random numbers function by specifying a seed and sample size.
Syntax:
rhyper(x, m, n, k)
Example 1:
set.seed(400)
N <- 10000
y_rhyper <- rhyper(N, m = 50, n = 20, k = 30)
y_rhyper
hist(y_rhyper,
breaks = 50,
main = "")
|
Output :
Like Article
Suggest improvement
Share your thoughts in the comments
Please Login to comment...