How To Visualize Sparse Matrix in Python using Matplotlib?
Last Updated :
27 Apr, 2020
Matplotlib is an amazing visualization library in Python for 2D plots of arrays. Matplotlib is a multi-platform data visualization library built on NumPy arrays and designed to work with the broader SciPy stack.
Visualize Sparse Matrix using Matplotlib
Spy is a function used to visualize the array as an image similar to matplotlib imshow function, but it is used in case of sparse matrix instead of dense matrix. A sparse matrix is a matrix where most of the elements are zero.
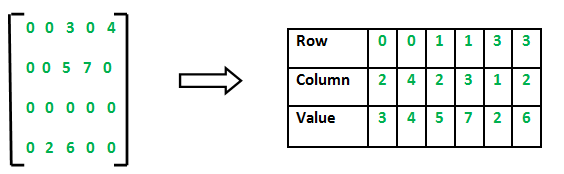
Sparse matrix and its representation
Spy function uses two plotting styles to visualize the array, these are:
Both the styles can be used for full arrays but in case of spmatrix instances only the marker style works. If marker or markersize is None then imshow function is used, and all the remaining keyword arguments are passed to this function; else, a Line2D object will be returned with the value of marker determining the marker type, and any remaining keyword arguments passed to plot function.
Syntax: matplotlib.pyplot.spy(Z, precision=0, marker=None, markersize=None, aspect=’equal’, origin=’upper’, \*\*kwargs)
Return value:
The return type depends on the plotting style, i.e. AxesImage or Line2D.
Parameters:
| Parameter |
Value |
Use |
| Z |
array-like (M, N) |
The array to be plotted |
| Precision |
float or ‘present’, optional
default:zero |
If precision is 0, any non-zero value will be plotted; else, values of |Z| > precision will be plotted.
For spmatrix instances, there is a special case: if precision is ‘present’, any value present in the array will be plotted, even if it is identically zero. |
| Origin |
{‘upper’, ‘lower’}, optional
default:’upper’ |
Place the [0, 0] index of the array in the upper left or lower left corner of the axes. |
| Aspect |
{‘equal’, ‘auto’, None} or float, optional
default:’equal’ |
It controls the aspect ratio of the axes. The aspect is of particular relevance for images since it may distort the image, i.e. pixel will not be square.
‘equal’: Ensures an aspect ratio of 1. Pixels will be square.
‘auto’: The axes is kept fixed and the aspect is adjusted so that the data fit in the axes. In general, this will result in non-square pixels.
None: Use rcParams[“image.aspect”]
|
Other parameters: **kwargs
These are the additional parameters that helps to get different plotting styles.
| Property |
Description |
| agg_filter |
a filter function, which takes a (m, n, 3) float array and a dpi value, and returns a (m, n, 3) array |
| alpha |
float or None |
| animated |
bool |
| antialiased |
bool |
| clip_box |
Bbox |
| clip_on |
bool |
| clip_path |
Patch or (Path, Transform) or None |
| color |
color |
| contains |
callable |
| dash_capstyle |
{‘butt’, ’round’, ‘projecting’} |
| dash_joinstyle |
{‘miter’, ’round’, ‘bevel’} |
| dashes |
sequence of floats (on/off ink in points) or (None, None) |
| data |
(2, N) array or two 1D arrays |
| drawstyle |
{‘default’, ‘steps’, ‘steps-pre’, ‘steps-mid’, ‘steps-post’} |
| figure |
figure |
| fillstyle |
{‘full’, ‘left’, ‘right’, ‘bottom’, ‘top’, ‘none’} |
| grid |
str |
| in_layout |
bool |
| label |
object |
| linestyle |
{‘-‘, ‘–‘, ‘-.’, ‘:’, ”, (offset, on-off-seq), …} |
| linewidth |
float |
| marker |
marker style |
| markeredgecolor |
color |
| markeredgewidth |
float |
| markerfacecolor |
color |
| markerfacecoloralt |
color |
| markersize |
float |
| markevery |
None or int or (int, int) or slice or List[int] or float or (float, float) |
| path_effects |
Abstract path effects |
| picker |
float or callable[[Artist, Event], Tuple[bool, dict]] |
| pickradius |
float |
| rasterized |
bool or None |
| sketch_params |
(scale: float, length: float, randomness: float) |
| snap |
bool or None |
| solid_capstyle |
{‘butt’, ’round’, ‘projecting’} |
| solid_joinstyle |
{‘miter’, ’round’, ‘bevel’} |
| transform |
matplotlib.transforms.Transform |
| url |
str |
| visible |
bool |
| xdata |
1D array |
| ydata |
1D array |
| zorder |
float |
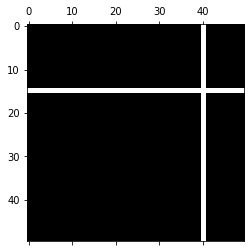
Example 1:
import matplotlib.pyplot as plt
import numpy as np
x = np.random.randn(50, 50)
x[15, :] = 0.
x[:, 40] = 0.
plt.spy(x)
|
Output:
Example 2:
import matplotlib.pyplot as plt
import numpy as np
x = np.random.randn(50, 50)
x[15, :] = 0.
x[:, 40] = 0.
plt.spy(x, precision = 0.1, markersize = 5)
|
Output:

Share your thoughts in the comments
Please Login to comment...